In February 2008, a reader requested evaluation of the market timing value of Xyber9 trend forecasts for the U.S. stock market, as developed and presented by Robert Taylor, CEO of Trend Corporation, Inc. Our conclusion then was that the claimed accuracy rate probably derives not from forecasting skill but from defining targets that are hard to miss. In June 2014 via email, Robert Taylor reported: “I was nominated for the Nobel Memorial Prize in Economics in March of 2000 for proving the financial markets are not random, but rather predictable. During the past 8 and a half years my U.S. Market forecasts…averaged better than 80% accuracy, including several years with an accuracy of over 90%, while the worse year produced over 70% accuracy.” He claims an aggregate forecast accuracy “greater than 83%”. He bases his forecasts on “Taylor’s Law”: “The financial market’s expansion and contraction is qualitatively in direct correlation to the increases and decreases in gravitational fluctuations experienced at the human level. The increases in market price are in direct response to decreases in gravitational forces; the decreases in market price are in direct response to the increases in gravitational forces.” He measures forecast accuracy as follows:
Robert Taylor observed that the accuracies reported in Guru Grades are rather low and inquired about a review of his forecasts, which for the U.S. market typically project short-term (a few days) trends in the S&P 500 Index and/or SPDR S&P 500 (SPY). Using daily highs and lows for the S&P 500 Index during March 2006 (when the Xyber9 historical forecasts commence) through June 2014, we find that:
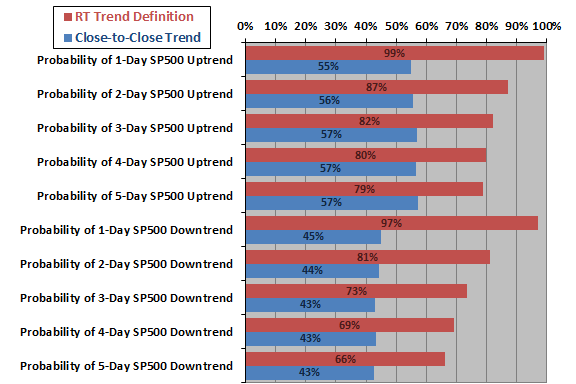
The following chart shows the frequencies with which the S&P 500 Index exhibits an uptrend and downtrend over the next one, two, three, four and five trading days, based on two definitions of trend:
- Robert Taylor’s (RT) trend definition as stated above, based on intraday highs and lows.
- Close-to-close trend, with an uptrend (downtrend) indicated when the close on the last day of the measurement interval is above (below) the close at the beginning of the measurement interval.
For example, the probability that the S&P 500 Index will exhibit a 3-day uptrend based on Robert Taylor’s trend definition (close-to-close trend) is 82% (57%). The probability that the S&P 500 Index will exhibit a 3-day downtrend based on Robert Taylor’s trend definition (close-to-close trend) is 73% (43%).
In other words, benchmark accuracies for demonstration of trend forecasting ability based on Robert Taylor’s definition of trend are relatively high, and (as for both definitions) somewhat higher for uptrends than downtrends. By this definition, the S&P 500 Index can trend both up and down across the same string of days.
Neither of these definitions of trend are clearly useful to investors because they do not indicate whether trends are large enough to exploit and do not describe what happens during the trend interval. For Robert Taylor’s definition of trend, investors cannot even determine in advance exactly when the trend interval starts and stops.

The overall trend forecast accuracy and the range of accuracies that Robert Taylor reports based on his self-assessment do not seem compellingly skillful relative to the “RT Trend Definition” benchmarks in the above chart. It appears feasible to group his forecasts by trend direction/duration and match group accuracies to the these benchmarks, but we are not undertaking such a detailed review at this time.
In summary, top-down assessment of Robert Taylor’s self-reported trend forecast accuracy versus benchmarks based on his definition of trend do not clearly offer support for belief that his forecasts are skillful.
Robert Taylor also sent via email TradeStation output data for a hypothetical strategy that harvests E-mini S&P 500 futures volatility via stop-gains on long or short positions, with stop-losses to mitigate crashes. He uses two short-term moving averages of different lengths measured at 30-minute intervals to determine entry points, opening long (short) trades at bullish (bearish) crosses during uptrend (downtrend) Xyber9 trend forecasts. He claims extremely good performance for this strategy, with backtested compounded (from 10 up to 50 contracts) returns averaging about 1,000% per year during 2006 through 2013.
A spot check of 25 of his trade entry prices for the first half of 2014 (September 2014 futures) versus CME data indicates that entry prices are approximately 30-minute interval opening prices. However, there is a one half hour difference in time stamps, with approximately matching CME data having time stamps one half hour earlier than the TradeStation time stamps.
Robert Taylor apparently does not publish the modeled trades in advance and does not have any actual trading records related to this strategy. Investors considering use of the Xyber9 trend forecasts and associated futures trading strategies may want to test the strategies themselves and request some actual trading records to assess practical use.