Do returns for segments of the normal U.S. stock market trading day (9:30 AM to 4:00 PM Eastern time) exhibit exploitable interactions? In the May 2014 version of their paper entitled “Intraday Momentum: The First Half-Hour Return Predicts the Last Half-Hour Return”, Lei Gao, Yufeng Han and Guofu Zhou investigate intraday U.S. stock market predictability based on half-hour segments. They focus on interaction between returns for the first and last half-hour segments. Using half-hour returns for SPDR S&P 500 (SPY) since January 1999 and for PowerShares QQQ (QQQ) since March 1999 and contemporaneous release dates for major economic statistics through December 2012, they find that:
- From in-sample tests:
- The first half-hour return for SPY predicts the last half-hour return with R-squared 0.02, indicating that early return explains about 2% of the variation in late return.
- In combination, the first and 12th half-hour returns predict last (13th) half-hour return with R-squared 0.035.
- The strength of these relationships generally increases with return volatility. When first half-hour return volatility is high, the the combined first and 12th half-hour returns predict last half-hour return with R-squared 0.048.
- Predictability is also stronger during recessions and on days of some economic news releases. For example, during 2006 through December 2009, R-squared for the first half-hour (combined first and 12th half hours) predictor is 0.043 (0.071).
- From out-of-sample tests over the entire sample period:
- R-squared is as high as 0.018 (0.027) using first half-hour return (combined first and 12th half-hours returns) as predictor.
- Holding SPY (cash) during the last half-hour when the first half-hour return is positive (negative) generates a gross annualized return of 6.3%, compared to -0.5% for holding SPY during all last half-hours.
- Results are qualitatively similar, but somewhat weaker, for QQQ.
- Results are consistent with day traders betting on reversal of the return for the first half-hour and then exiting the bet during the last half-hour.
In summary, evidence indicates a modest positive relationship between U.S. stock market returns during the first and last half-hours of the normal trading day.
Cautions regarding findings include:
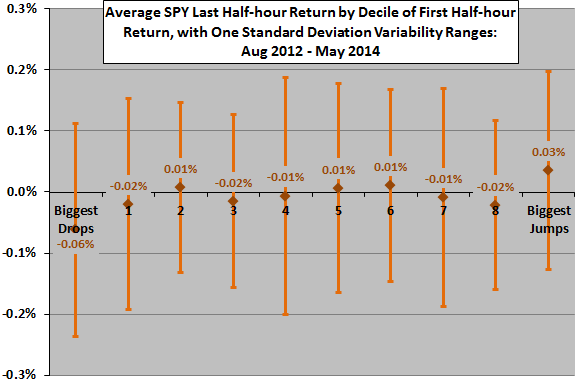
- Tests of the economic significance of statistical findings ignore trading frictions. These frictions would materially affect exploitability (see the chart below).
- Experimenting with different half-hour segments, combined segment signals and overlays of other indicators (volatility and economic announcements) incorporates data snooping bias (luck), such that the best results likely overstate expected predictor performance.
To confirm findings in the paper, we relate first half-hour SPY returns to last half-hour returns from the data used in “Recent Intraday U.S. Stock Market Behavior” during August 2012 through May 2014 (441 trading days). The Pearson correlation for the relationship is 0.12 and the R-squared statistic 0.014, indicating that first half-hour return explains 1% to 2% of the variation in last half-hour return.
For further insight, we calculate average last half-hour returns by ranked tenth (decile) of first half-hour returns. There are 44 observations per decile. The following chart summarizes results, indicating that extreme first-hour returns drive any anomaly. However, the last half-hour returns for the biggest first half-hour drops and jumps are on average too small in magnitude for most investors to exploit (trading frictions would swamp returns).
