Research (see “Asset Growth Rate as a Return Indicator” and “Asset Growth a Bad Sign for Stocks Everywhere?”) indicates that stocks of firms with high asset growth rates tend subsequently to underperform the market. Does this finding translate to the overall stock market? In the April 2014 version of his paper entitled “Asset Growth and Stock Market Returns: a Time-Series Analysis”, Quan Wen examines whether the asset growth anomaly observed at the firm level applies in aggregate to the U.S. stock market. He also investigates whether any aggregate effect is predominantly behavioral or risk-based. He estimates aggregate growth rate quarterly as the market capitalization-weighted sum of firm-level percentage changes in book value of total assets. To ensure all asset data is known to investors, he relates asset growth rate to returns two quarters later. Using quarterly U.S. stock market excess returns (relative to the risk-free rate), asset growth rates for listed U.S. firms that employ calendar year accounting, analyst forecasts/revisions, stock returns around earnings announcements, and data required for comparison of asset growth with other U.S. stock market indicators during 1972 through 2011, he finds that:
- Over the sample period, average quarterly aggregate asset growth rate is 3.4%, with standard deviation 1.7%.
- Aggregate asset growth rate relates negatively to future stock market excess return. Specifically:
- The correlation between aggregate asset growth rate and stock market return two quarters later is about -0.25.
- In-sample, a one standard deviation increase in the quarterly aggregate asset growth rate indicates a decline in stock market excess return two quarters later of about 2.3%. The effect persists three quarters later.
- Out-of-sample, asset growth rate outperforms historical average and nearly all other commonly used stock market indicators.
- Components making the strongest contributions to the predictive power of asset growth rate are changes in: non-cash operating assets, cash, operating liability and equity financing.
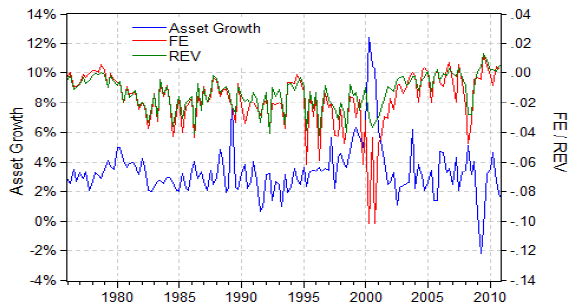
- Aggregate asset growth rate relates negatively to future sets of analyst forecast revisions, sets of earnings surprises and returns around the next two sets of earnings announcements (see the chart below).
The following chart, taken from the paper, compares the time series of quarterly aggregate asset growth rate to those for aggregate analyst forecast errors (FE) and forecast revisions (REV). High asset growth rates tend to lead negative forecast errors and downward forecast revisions. This pattern is consistent with incorrect analyst extrapolation of asset growth rate.

In summary, evidence indicates that investors may be able to exploit aggregate asset growth rate to time the U.S. stock market because analysts and other investors tend to overreact to recent asset growth trends.
Cautions regarding findings include:
- Reported stock market returns are gross, not net. Incorporating reasonable trading frictions (or fund fees) would reduce indicator effectiveness.
- Calculating aggregate asset growth for the entire stock market may be problematic for investors, or costly if delegated. There may be some smaller aggregation, such as the stocks in the Dow Jones Industrial Average or a sector, that many investors could tackle themselves.