Does the carry trade concept provide a useful framework for valuation of securities within and across all asset classes? In their July 2013 paper entitled “Carry”, Ralph Koijen, Tobias Moskowitz, Lasse Pedersen and Evert Vrugt investigate expected return across asset classes via decomposition into “carry” (expected return assuming price does not change) and expected price appreciation. They measure carry for: global equities; global 10-year bonds; global bond yield spread (10-year minus 2-year); currencies; commodities; U.S. Treasuries; credit; equity index call options; and equity index put options. Their measurements of carry vary by asset class (based on: futures prices for equity indexes, currencies and commodities, modeled futures prices for global bonds, U.S. Treasuries and credit; and, option prices for options). They further decompose carry returns into passive and dynamic components. The passive component is the return to a hedge (carry trade) portfolio designed to capture differences in average carry returns across securities, and the dynamic component indicates how well carry predicts future price appreciation. Finally, they determine the conditions under which carry strategies perform poorly across all asset classes. Using monthly price/yield data for multiple assets within each class as available during January 1972 through September 2012, they find that:
- Carry returns relate closely and positively to total expected returns within and across major asset classes. This predictability underlies strong returns to carry trades (long high-carry and short low-carry securities).
- Carry return relates positively to value in equities and momentum in fixed income and commodities, but carry is largely independent of these other factors as a return predictor.
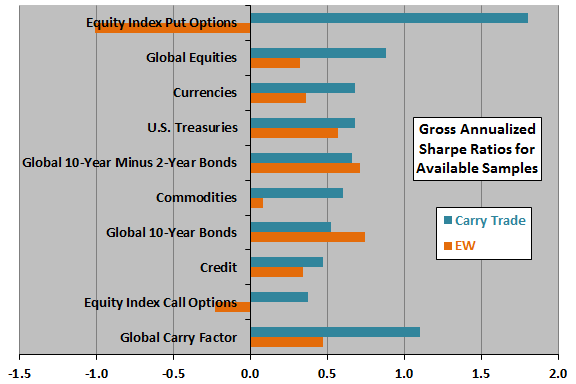
- Carry trade portfolios within asset classes generate an average annualized gross Sharpe ratio of about 0.7 over the sample period, while a portfolio of carry strategies across all asset classes generates a gross Sharpe ratio of 1.1 (see the first chart below).
- Applying carry to time individual securities by going long (short) when carry is positive (negative) or above (below) its long-run average generates average performances by asset class similar to those from cross-sectional carry trades.
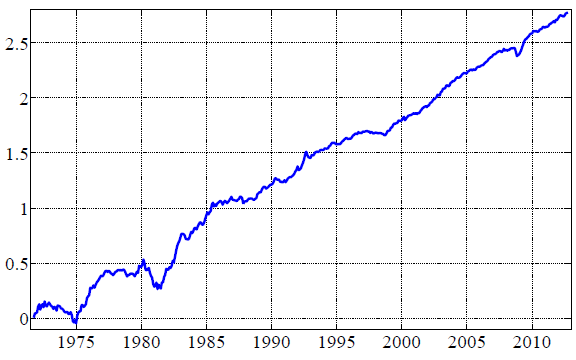
- Carry trades perform poorly across all asset classes at times coinciding with global recessions, with the three largest drawdowns during August 1972 to September 1975, March 1980 to June 1982 and August 2008 to February 2009 (see the second chart below).
- The dynamic carry component (predicted price appreciation) constitutes most of the total returns of the equity, fixed income and options carry strategies, about half of the returns of the currency and commodity carry strategies, and a little less than half the returns to the U.S. Treasury and credit carry strategies.
The following chart, constructed from data in the paper, summarizes annualized gross Sharpe ratios for carry trades (long-short hedge portfolios) applied to securities within each asset class, with Sharpe ratios for equally weighted portfolios included as benchmarks. Carry trades derive from weighting all securities within each class according to carry (not selecting just those with extreme carries). The “global carry factor” represents a portfolio diversified over all asset class carry trades, weighted by the inverse of their respective full-sample volatilities (standard deviations of returns).
Carry trades outperform equal-weight benchmarks for seven of nine asset classes.

The next chart, taken from the paper, shows the gross cumulative return for the global carry factor as defined for the chart above, with each asset class carry trade contributing about the same level of volatility to the overall portfolio. The three biggest global carry factor drawdowns are during August 1972 to September 1975, March 1980 to June 1982 and August 2008 to February 2009.

In summary, evidence suggests that the carry trade concept may apply usefully within and across all major asset classes.
Cautions regarding findings include:
- Data collection and computation burdens involved in implementation of carry trades across asset classes are beyond the reach of most investors, and may be costly if delegated.
- The study apparently uses gross, not net, returns with monthly rebalancing of many assets. Accounting for the trading frictions incurred would reduce reported returns, perhaps very differently across asset classes.
- The global carry factor specified in the charts above weights asset class carry trade returns by full-sample inverse volatilities, thereby incorporating look-ahead bias. An investor operating in real time would measure different and changing (historical only) volatilities.
- There may be different ways of defining/measuring the carry trade by asset class.