A subscriber suggested that the Federal Reserve Bank of Chicago’s National Financial Conditions Index (NFCI) may be a useful U.S. stock market predictor. NFCI “provides a comprehensive weekly update on U.S. financial conditions in money markets, debt and equity markets, and the traditional and ‘shadow’ banking systems.” It consists of 105 inputs, including the S&P 500 Implied Volatility Index (VIX) and Senior Loan Officer Survey results. Positive (negative) values indicate tight (loose) financial conditions, with degree measured in standard deviations from the mean. The Chicago Fed releases NFCI each week as of Friday on the following Wednesday at 8:30 a.m. ET (or Thursday if Wednesday is a holiday), renormalized such that the full series always has a mean of zero and a standard deviation of one (thereby each week changing past values, perhaps even changing their signs). To investigate its usefulness as a U.S. stock market predictor, we relate NFCI and changes in NFCI to future S&P 500 Index returns. Using weekly levels of NFCI and weekly closes of the S&P 500 Index during January 1971 (limited by NFCI) through April 2020, we find that:
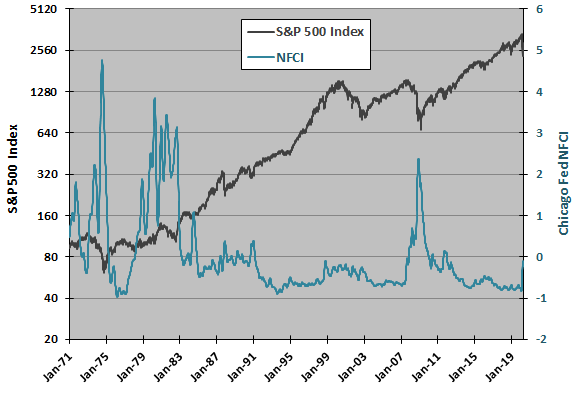
The following chart tracks weekly levels of the S&P 500 Index (on a logarithmic scale) and NFCI over the available sample period. Visual inspection suggests a negative relationship between the two series, accentuated when NFCI spikes, but it is not obvious whether one series leads the other. Cumulative effects of weekly renormalizations can be large, undermining use of the series for backtesting.
However, renormalizations should have little effect on past weekly changes in NFCI, so we focus on relating weekly changes in NFCI to future weekly stock market returns.
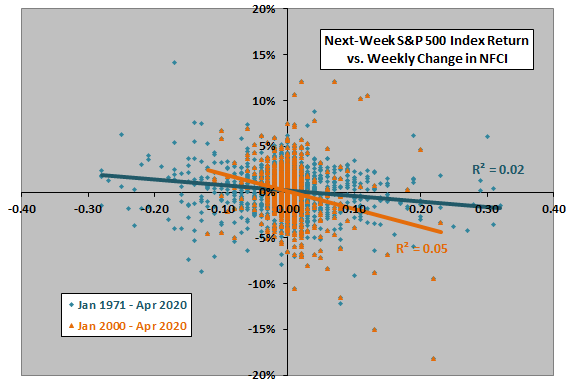
The following scatter plot relates next-week (measured week, Friday close to Friday close) S&P 500 Index return to weekly change in NFCI over the full sample period and over a subperiod since the beginning of 2000. We ignore stock market returns during two weeks in September 2001 due to market closure. The Pearson correlation over the full sample period is -0.13, confirming a negative relationship, and the R-squared statistic is 0.02, indicating that weekly change in NFCI explains 2% of variation in next-week stock market return. The relationship is somewhat stronger since the beginning of 2000 (Pearson correlation -0.22), with weekly change in NFCI explaining about 5% of variation next-week stock market return.
The relationship as presented is not fully exploitable because NFCI releases occur in the middle of the next-week return measurement interval. However, correlations of weekly changes in NFCI based on lagged release date-to-release date (Wednesday open to Wednesday open) weekly returns are the same, -0.13 and -0.22, respectively.
Might the relationship persist over a longer horizon?
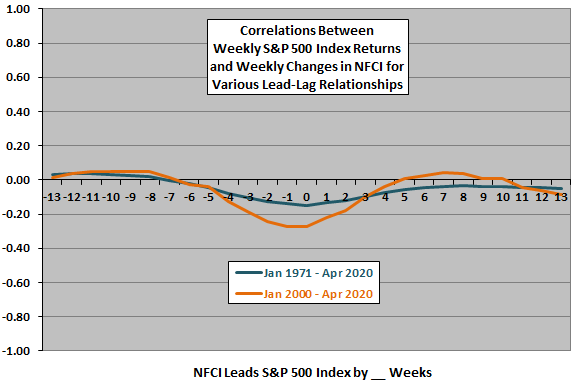
The next chart summarizes Pearson correlations between weekly change in NFCI and weekly S&P 500 Index return (measured week) for lead-lag relationships ranging from stock market return leads change in NFCI by 13 weeks (-13) to change in NFCI leads stock market return by 13 weeks (13) over the full sample period and a subperiod since the beginning of 2000. Results indicate mutual predictive power for the two series, somewhat stronger in recent data. Specifically:
- A relatively strong (weak) U.S. stock market over the past four weeks indicates a decrease (increase) in NFCI.
- An increase (decrease) in NFCI indicates a relatively weak (strong) U.S. stock market over the next four weeks.
Results using lagged release date-to-release date S&P 500 Index returns rather than measured week returns are very similar.
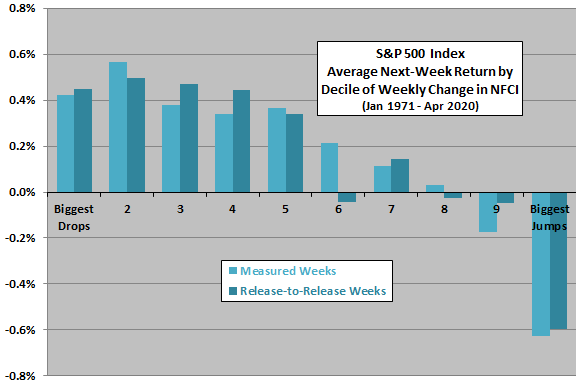
Might there be an important non-linearity in the relationship? To check, we calculate average next-week stock market return by range of changes in NFCI.
The final two charts summarize average next-week S&P 500 Index returns for both measured weeks and lagged release date-to-release date returns by ranked tenth (decile) of weekly changes in NFCI over the full sample period (upper chart) and a subperiod since the beginning of 2000 (lower chart). Results consistently suggest that change in NFCI is a potential crash protection indicator, with the biggest weekly jumps preceding poor average next-week U.S. stock market returns. However, progressions across deciles are not very systematic.
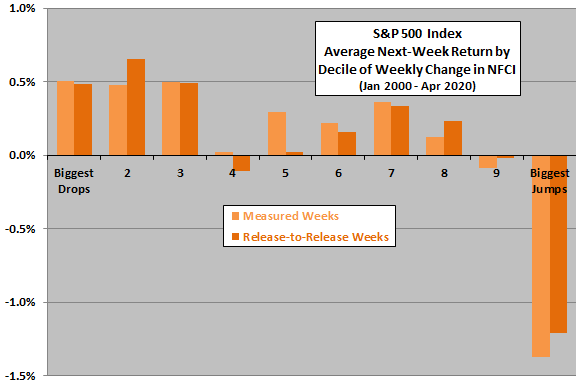
In summary, evidence from simple tests suggests that weekly change in NFCI may be a useful indicator of future U.S. stock market returns, principally by helping to avoid some or most of stock market crashes.
Cautions regarding findings include:
- As noted, continual renormalization of NCFI each week alters past values and undermines its direct use for backtesting.
- Analyses are in-sample. An investor operating in real time may draw different conclusions at different points during the sample period, though effects are consistent in the recent subsample.
- The very complex and evolving nature (occasional model changes) of NFCI raises suspicion of data snooping bias in its most recent formulation, such that predictive power of older data is overstated.
- NFCI did not exist during most of the sample period (data are backfilled), and there is no feedback from the market for its publication until 2010.
- Exploitation of weekly data may drive frequent trading and therefore high cumulative trading frictions.
- The analysis does not account for stock dividends.