Is equity market liquidity useful as an asset allocation signal? In their November 2012 paper entitled “Liquidity-Driven Dynamic Asset Allocation”, James Xiong, Rodney Sullivan and Peng Wang examine the performance of a dynamic stocks-bonds allocation strategy with weightings based on equity market liquidity. For liquidity measurement, they focus on monthly changes in Amihud illiquidity (aggregating individual responses of stock prices to trading volume), calculated daily for a broad sample of U.S. stocks, averaged over the past six months and detrended. They also consider a similarly calculated monthly change in aggregate stock market turnover as an alternative liquidity measurement. For each measurement, they define high and low expected liquidity premium conditions based on a fixed liquidity threshold. They then use this threshold to define a dynamic asset allocation (DAA) strategy for a simple portfolio consisting of stocks (four U.S. style indexes, a REIT index and MSCI EAFE as separate proxies) and bonds (proxied by the Barclays Capital 1-3 Year Government/Credit Index). The benchmark strategic asset allocation (SAA) is 50% stocks and 50% bonds, rebalanced monthly. The DAA strategy each month allocates 60% (30%) to stocks and 40% (70%) to bonds when the expected equity liquidity premium is high (low), with monthly trading friction 0.1% of the value of the portfolio turned over. Using liquidity calculation inputs since January 1963 and portfolio asset total monthly returns since December 1980, both through September 2010, they find that:
- Declines in Amihud illiquidity materially below trend indicate a relatively low equity liquidity premium and typically precede market downturns. Illiquidity gradually returns to normal as investor confidence recovers. Using the turnover liquidity change metric rather than the Amihud change metric yields similar results.
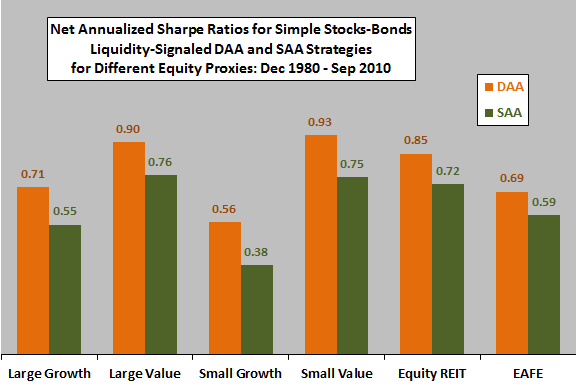
- Since the end of 1980, the DAA strategy applied to a simple stocks-bonds portfolios that tilts toward stocks (bonds) when the equity liquidity premium is relatively high (low) as specified above consistently outperforms the static SAA allocation (see the chart below).
- Results are generally robust to different ways of setting the liquidity threshold, including inception-to-date window estimation.
The following chart, constructed from data in the paper, summarizes net annualized Sharpe ratios for the DAA and SAA strategies described above as applied separately to each of six index proxies for the stock portion of the portfolio, as follows:
- Russell 1000 Growth (Large Growth)
- Russell 1000 Value (Large Value)
- Russell 2000 Growth (Small Growth)
- Russell 2000 Value (Small Value)
- FTSE NAREIT Equity REITs (REIT)
- MSCI EAFE (EAFE)
In all cases, the Barclays Capital 1-3 Year Government/Credit Index proxies for bonds.
Results consistently indicate that DAA based on the liquidity premium beats SAA, generally by elevating net annual returns with similar annual return volatilities.

In summary, evidence suggests that market liquidity may be a useful signal for adjusting weights of a diversified portfolio.
Cautions regarding findings include:
- The paper ignores costs of collecting and processing the considerable data needed for equity market liquidity calculations. Also, the study appears to assume problematically that there is no delay between monthly calculation of the six-month average liquidity metric and its use in monthly rebalancing of the DAA portfolio.
- Use of indexes rather than tradable assets ignores the costs (trading frictions and management fees) of forming and maintaining funds to track the indexes.
- The assumed 0.1% trading friction may be very optimistic for most investors prior to the introduction of exchange-traded funds tracking the selected indexes.
- The secular (disinflationary) bull market for bonds since the 1980s may be a factor in signal performance.