Do investors under stress herd, thereby driving return correlations upward? In their October 2012 paper entitled “Quantifying the Behavior of Stock Correlations Under Market Stress”, Tobias Preis, Dror Kenett, Eugene Stanley, Dirk Helbing and Eshel Ben-Jacob relate average stock return correlations to stock market conditions with focus on dramatic market losses. Specifically, they calculate the average Pearson correlation of daily returns among all 30 stocks comprising the Dow Jones Industrial Average (DJIA) over a specified interval (ranging from 10 to 60 trading days), accounting for occasional index revisions. They then relate this average correlation to normalized DJIA return over the same interval. They normalize an interval return by subtracting the average return for all such intervals in the sample period and then dividing by their standard deviation. Using daily closing prices of DJIA stocks during mid-march 1939 through December 2010, they find that:
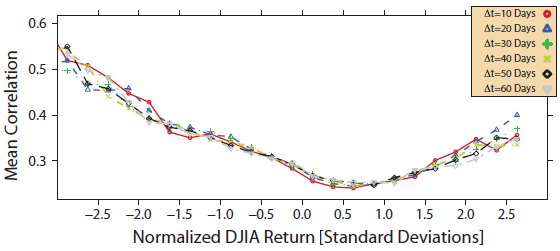
- The average daily correlation among returns of DJIA stocks tends to (see the chart below):
- Increase dramatically when the index exhibits stress, as indicated by strong declines.
- Be at a minimum when the index behaves “normally” (modest gains).
- Increase modestly when the index advances strongly.
- Results are largely independent of correlation/return measurement intervals ranging from 10 to 60 trading days.
- Consequently, the diversification of the index declines markedly when needed most.
The following chart, taken from the paper, summarizes the coincident relationship between average (mean) daily correlation of DJIA component stock returns and normalized DJIA return in units of standard deviations as described above for various correlation/return measurement intervals over the entire sample period. The average correlation varies considerably with market conditions, from lows under “normal” market conditions of modestly positive returns to highs under conditions of extremely negative returns. In other words, index diversification is strongest (weakest) when markets are calm (crashing). Results are largely insensitive to lengths of the correlation/return measurement interval in the range 10 to 60 trading days.

In summary, evidence indicates that the coincident relationship between average correlation of stock returns and stock market return varies considerably, with calm (crash) conditions associated with a relatively low (high) correlation.
Cautions regarding findings include:
- The correlation-return relationship examined in the study is coincident, not predictive, and the authors do not explore any strategic or tactical strategies designed to exploit findings.
- The process of normalizing DJIA interval returns is in-sample, covering the entire sample period. An investor operating in real time, using only historical data, might thus generate different results.
For related research, see “Stock Return Correlations and Retail Trader Herding”.