How does the risk parity asset allocation strategy (equalizing the volatility contributions of portfolio components) fare in comparison to other commonly used strategies? In their March 2012 research note entitled “The Risk Parity Approach to Asset Allocation – Climbing the Wall of Worries?”, Fabian Dori, Frank Haeusler, Manuel Krieger, Urs Schubiger and David Stefanovits contrast three popular allocation strategies: (1) traditional balanced (40% equities, 50% bonds and 10% commodities); (2) minimum variance (the mean-variance optimized portfolio with the lowest variance); and, (3) risk parity. Their asset universe includes equity index futures (FTSE 100, DAX, S&P 500, TOPIX and ASX SPI 200), 10-year government bond futures (UK, German, U.S., Japanese and Australian) and commodity index futures (GSCI agriculture, energy, industrial and precious metals and softs). For each asset allocation strategy, they model daily rebalancing of assets to specified weights. Using daily futures return data during August 1992 through June 2012, they find that:
- Over the sample period, with no leverage or short selling, the traditional balanced, minimum variance and risk parity strategies generate, respectively:
- Average annualized returns of 3.4%, 2.2% and 3.2%.
- Annualized Sharpe ratios of 0.55, 0.79 and 1.00.
- Annualized Sortino ratios (accounting for downside volatility only) of 0.72, 1.05 and 1.37.
- Maximum annual drawdowns of 26.1%, 10.0% and 12.5%.
- The traditional balanced (minimum variance) strategy produces the least (most) concentrated portfolio.
- The traditional balanced (risk parity) strategy exhibits the highest (lowest) return distribution tail risk.
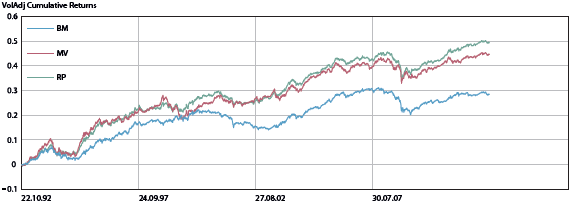
- Overall, the minimum variance and risk parity strategies beat the traditional balanced strategy on a risk-adjusted basis, providing a smoother and more attractive return/risk profile (see the chart below).
The following chart, taken from the paper, compares gross cumulative return trajectories of the above three asset allocation strategies on a volatility-adjusted (leveraged) basis over the specified sample period. The minimum variance (MV) and risk parity (RP) strategies similarly outperform a traditional balanced mandate (BM). In other words, asset allocation based on risk rather than capital pays off on a gross basis in the long run.

In summary, evidence suggests that a risk parity strategy is an attractive compromise between a simple but risky static allocation strategy and the more complex minimum variance strategy.
Cautions regarding findings include:
- Reported return statistics are gross, not net. Daily rebalancing means rapid accrual of trading frictions, which would reduce these returns. Moreover, accrued frictions may differ substantially among the three strategies due to different levels of portfolio turnover.
- The chart above does not account for the costs of leverage implied by volatility adjustment for the minimum variance and risk parity strategies. These costs would reduce cumulative returns for these two strategies.
- It would be interesting to compare also a simple strategy that weights assets, or asset classes, equally.