Is there a reliable signal for exiting a stock momentum strategy before months during which the strategy crashes? In the June 2012 version of their paper entitled “Tail Risk in Momentum Strategy Returns”, Kent Daniel, Ravi Jagannathan and Soohun Kim investigate conditions under which a basic U.S. stock momentum strategy performs very poorly and develop a model to anticipate these conditions. Their momentum strategy is each month long (short) the equally weighted tenth of NYSE, AMEX, and NASDAQ stocks with the highest (lowest) lagged 11-month returns, with a skip month between ranking interval and portfolio formation. Their method of anticipating conditions associated with poor momentum returns is a fairly complex two-regime (calm or turbulent) market state model derived from momentum portfolio returns relative to market returns during the momentum ranking interval and other lagged market return statistics. Using the monthly momentum decile portfolio returns from Kenneth French’s data library for July 1929 through December 2010 (978 months), they find that:
- Over the entire sample period, the specified momentum strategy has an average gross monthly return of 1.12% in excess of the risk-free rate and a gross monthly Sharpe ratio of 0.14, compared to a Sharpe ratio of 0.10 for buying and holding the market. The three-factor (adjusting for market, size, book-to-market) gross monthly alpha of the momentum strategy is 1.70%.
- The momentum strategy return distribution is strongly leptokurtic and highly left skewed, with 13 of 978 months having losses over 20%. The worst five monthly returns for the strategy are -79%, -60%, -46%, -44% and -42%.
- When the modeled market state is turbulent, momentum strategy returns have a strongly negative beta.
- Based on total-sample (meaning in-sample) estimation of market state model parameters:
- All 13 months with momentum strategy losses over 20% occur during the 199 months when the probability of market turbulence exceeds 50%.
- In comparison, eight of 11 months with momentum strategy gains exceeding 20% also occur during these 199 months.
- The average gross monthly momentum return during months when the probability of market turbulence is above (at or below) 50% is -0.47% (1.53%), with Sharpe ratio -0.03 (0.30).
- For inception-to-date (meaning out-of-sample) modeling of the market state during September 1977 through December 2010:
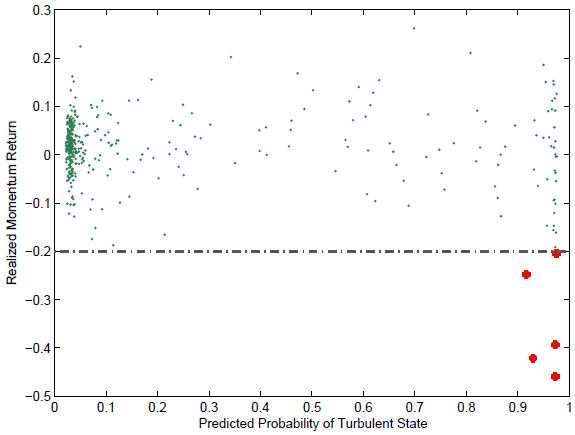
- All five months during with momentum strategy loses over 20% occur during the 79 months when the probability of market turbulence exceeds 50%. In fact, all five extreme losses occur when the turbulent state probability exceeds 90%.
- In comparison, two (zero) of four months with momentum strategy gains exceeding 20% occur during months when the probability of the turbulent state exceeds 50% (90%).
- During the three consecutive months in 2009 when the momentum strategy incurs large losses, the probability of the turbulent market state exceeds 97%.
- With a turbulent state threshold of 90%, which classifies a tenth of the 400 out-of-sample months as turbulent, the Sharpe ratio of momentum returns for turbulent (non-turbulent) months is -0.26 (0.38).
- There is little relationship between probability of market turbulence and National Bureau of Economic Research recessions.
The following chart, taken from the paper, plots monthly momentum strategy returns versus the out-of-sample probability of the month being in a turbulent state during September 1977 through December 2010. Observations tend to become increasingly dispersed as probability of turbulence increases. Months with losses exceeding 20% (highlighted in red) all occur when the probability of a turbulent state exceeds 90%.

In summary, evidence indicates that complex modeling of the relationship between lagged momentum returns and lagged market returns/volatility reliably screens out momentum crash months.
Cautions regarding findings include:
- As noted, the calm versus turbulent market state model is complex and likely beyond the reach of many investors. See “Avoiding Momentum Strategy Crashes” for a simpler, more accessible metric (momentum portfolio return volatility) for avoiding the left tail of stock momentum strategy returns.
- Reported returns are gross, not net. Including reasonable estimates of trading frictions (which tend to be relatively high for stock momentum strategies) would reduce returns and may affect findings. Occasional portfolio liquidation incurs incremental frictions.
- The study does not consider the cost and feasibility of shorting losers.
- There may be data snooping bias in model specifications.
Both “Simple Sector ETF Momentum Strategy” and “Doing Momentum with Style (ETFs)” test a simple way to avoid momentum crashes for exchange-traded funds.