A subscriber suggested review of the Arora Report trading performance. According to the offeror, this performance derives from application of the “ZYX Change Method”, which “is the culmination of over a quarter of a century of experimentation in developing fundamental, technical, and quantitative models as well as implementing gray boxes to execute the models in a variety of market conditions. …The method consists of six screens to be applied in a specific order and trade management guidelines.” In describing the performance data, the offeror states: “Every closed trade since inception in 2007, without exception, is included in the following performance record. …Typically, these stocks have enough liquidity to easily enter or exit large sizes.” Using the data for all 211 closed trades and other information on the Arora Report site available as of the end of May 2012, we find that:
Some basic statistics for the 211 closed positions are:
- Trade durations (“Average Days Held”) range from 1 day to 433 (calendar?) days, with average 57 days and median 21 days.
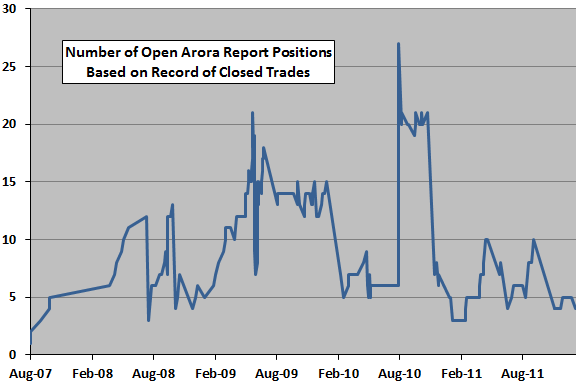
- The consequent number of active positions (based only on closed positions) ranges from 1 to 27, with average 11 and median 10.
- 66 (31%) positions are long, and 145 (69%) positions are short.
- Average gross return per trade is 22.2%. Only 13 positions (6.2%) generate gross losses.
- The “Terms of Use” of the Arora Report site states: “Actually trades may not have been made and thus performance figures should be considered hypothetical.” This statement implies that returns are gross, not net. Trading frictions (broker fees and bid-ask spreads) and any costs of shorting (stock borrowing fees and dividends) would reduce reported returns. Assuming round-trip costs of 1% (2%) per position, 11.4% (17.1%) of positions generate net losses.
- The widely varying number of positions complicates portfolio management. In order to avoid missing trades (and not knowing whether new positions will be long or short), a trader following the instructions would have to hold cash in reserve, and the portfolio may at times have a large cash reserve (see the chart below). Since the return on cash during the sample period is negligible, portfolio-level impacts would be much smaller than trade returns. Assuming portfolio-level implementation accommodating a maximum of 27 approximately equal-sized positions, average gross portfolio impact per closed position is 0.82%. Eliminating the largest single winner (an options trade) reduces this figure to 0.77%.
- Assuming round-trip costs of 1% (2%) per position and implementation accommodating a maximum of 27 approximately equal-sized positions, average net portfolio impact per closed position is 0.79% (0.75%). In other words, high profitability per position can absorb considerable trading costs.
The following chart tracks the number of active positions implied by the Arora Report record of 211 closed trades. The wide variation in number of positions complicates portfolio management. This summary does not include positions that may have been opened but not yet closed.

For a large number of trades over four to five years, the high win rate and average portfolio-level impact per position are attractive. However, the following aspects of available data confound analysis:
- Performance data is for closed trades only. There are likely other positions in play during the sample period, especially during the latter part. These open positions may constitute a bow wave of unfavorable performance. In other words, reporting only closed positions with latitude to wait over a year until positions become profitable until closing them may significantly bias performance upward. Moreover, it is possible that the offeror selected a favorable start date.
- Examination of the “Market Blog” associated with trade entry and exit instructions indicates that many “positions” involve multiple partial entry and partial exit dates, obscuring exact performance and elevating trading frictions. The blog sometimes does not specify the size of partial actions. The “Terms of Use” of the Arora Report site state: “The site or Blog may not describe the trade management and risk control for every trade.”
- Most of the trades are shorts. The assumed levels of trading costs may not cover those for long-term short positions, which include stock borrowing fees and dividend reimbursements. There is also potential for margin calls while short positions are active.
In summary, while the data provided on Arora Report closed trades appear attractive, there is not enough information for confident net portfolio-level performance evaluation.