Is drawdown control a practical investment policy? In their February 2012 paper entitled “Optimal Portfolio Strategy to Control Maximum Drawdown: The Case of Risk-based Active Management with Dynamic Asset Allocation” (the National Association of Active Investment Managers’ 2012 Wagner Award third place winner), George Yang and Liang Zhong examine maximum percentage drawdown target as a criterion for active portfolio asset class allocation. They name the strategy Rolling Economic Drawdown-Controlled Optimal Portfolio Strategy (REDD-COPS), with REDD defined as maximum percentage drawdown of an asset’s value during a one-year rolling historical window. They simplify asset allocation calculations by assuming that the maximum drawdown target represents investor risk aversion. They test the active strategy on three asset class indexes: the S&P 500 Total Return Index, Barclays Capital 20+ Year U.S. Treasury Bond Index and Dow-Jones UBS Commodity Total Return Index, with the 3-month U.S. Treasury bill (T-bill) as the risk-free asset. Using daily, weekly and monthly data for these asset class proxies from as far back as January 1951 (but January 1991 for most tests) through June 2011, they find that:
- Scaling positions by respective ratios (D – REDD)/(1 – REDD), where D is the maximum percentage drawdown target, is key to portfolio drawdown control.
- In-sample testing (optimized using the total sample to determine Sharpe ratios and return correlations for asset class allocation purposes) indicates that:
- For a portfolio consisting of stocks and T-bills: (1) over the entire 60.5 year sample period, lower maximum drawdown targets outperform higher ones in terms of Sharpe ratio but not annualized return or terminal value; and, (2) during January 1991 through June 2011, monthly portfolio reallocation outperforms daily and weekly reallocations based on both gross returns and gross risk-adjusted returns due to momentum versus reversion effects.
- For a portfolio consisting of stocks, bonds and T-bills during January 1991 through June 2011, maximum drawdown control allocation dominates traditional stocks/bonds asset allocation strategies such as 60/40, minimum variance (left-most portfolio on the efficient frontier from Modern Portfolio Theory) and leveraged risk parity.
- For a portfolio consisting of stocks, bonds, commodities and T-bills during January 1991 through June 2011, addition of commodities significantly boosts return but with somewhat higher standard deviation.
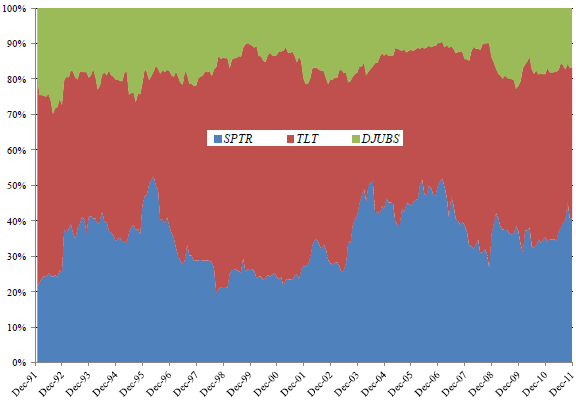
- A simplified, out-of-sample, risk-based REDD-COPS strategy (see the chart below) beats traditional risk-based asset allocation portfolios with similar maximum drawdowns by roughly 5% annualized.
- Simplified means assuming asset class return correlations are zero.
- Out-of-sample means calculating asset class return volatilities using lagged data only (while assuming constant Sharpe ratios).
- Risk-based means leveraging the REDD-COPS and benchmark portfolios to equalize return volatilities, with the cost of leverage at the risk-free rate.
The following chart, taken from the paper, summarizes the relative allocations to stocks (SPTR – blue), bonds (TLT – red) and commodities (DJUBS – green) over the 20-year out-of-sample test period for a 20% maximum drawdown target. Relative allocation variability ranges are about 20% to 53% for stocks, 29% to 66% for bonds and 10% to 30% for commodities.

In summary, evidence suggests that an active asset allocation strategy focused on control of maximum drawdown outperforms several simple and formal asset allocation strategies.
The paper illustrates the arguability of assumptions and complexity of calculations involved in making theoretical asset allocation tractable. It would be interesting to compare performances of the REDD-COPS portfolios with those of comparable equally weighted ones.
Cautions regarding findings include:
- As noted in the paper, in-sample tests incorporate look-ahead bias into estimates of asset class Sharpe ratios (average returns and return standard deviations) and return correlations.
- Return calculations are gross, not net. Incorporating reasonable trading frictions for monthly portfolio rebalancing would reduce reported returns. Moreover, indexes do not reflect the costs of creating and maintaining tradable assets (trading frictions and management fees), and accounting for such costs would also lower reported returns.
- Any cost of leverage above the T-bill yield would degrade performances of the risk-based strategies.
- As noted in the paper, the simplified REDD-COPS strategy makes the arguable assumptions that asset classes have long-term zero correlations, tame return distributions and stable risk premiums.