Has the free flow of capital since the 1990s weakened geographic (country-based) equity market diversification benefits? In their November 2011 paper entitled “Is World Stock Market Co-Movement Changing?”, Douglas Blackburn and N. K. Chidambaran examine recent trends in co-movement of stock markets worldwide. Their analysis employs principal component analysis to identify country, regional and world equity market return factors, allowing for structural break. They then quantify country commonality with the world factor via correlations. Using weekly return data for 23 developed country equity market indexes as available during 1981 through 2010 (30 years) and ten emerging country equity market indexes as available during 2000 through 2010, they find that:
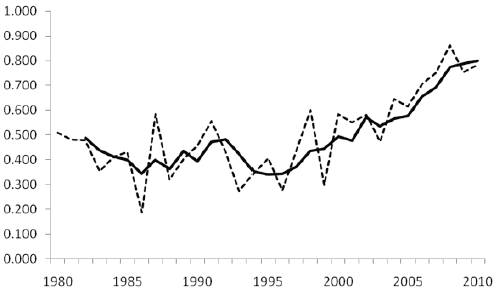
- Co-movements of the 23 developed equity markets with their combined (developed world) return factor are stable through the mid-1990s, but then exhibit a structural break and increase dramatically to a high of 80% in 2009. Co-movement remains high, over 70%, in 2010. (See the charts below.)
- Co-movements of the ten emerging equity markets with their combined (emerging world) return factor also increase during 2000 through 2010.
- The correlation between the developed world and emerging world return factors is large and increasing during 2000-2010, suggesting that developed and emerging market behaviors are converging to a common world factor. Correlations between value-weighted developed and emerging market indexes are as much as 30% lower than those indicated by factor analysis, but also increasing over time.
- International investment flows, rather than fundamental firm valuations (cash flows), appears to be the main driver of the increase in equity market co-movement.
The following chart, taken from the paper, plots the average annual return correlation for the 23 developed equity market indexes with the developed world return factor over the entire sample period (dotted line), along with its three-year moving average (solid line). Results indicate a structural break in the mid-1990s between a stable state and an increasingly integrated state.

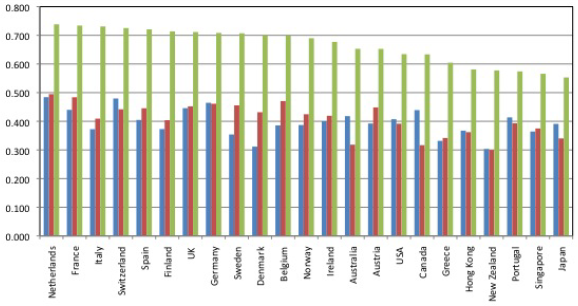
The next chart, also from the paper, summarizes the annual return correlations for each of 23 developed equity market indexes with the developed world return factor over three subperiods: 1981-1989 (blue columns); 1990-1999 (the red columns); and, 2000-2010 (green columns). Results indicate that the recent increase in equity market correlations is uniform worldwide.

In summary, evidence indicates that financial investment pressures drive increasing integration of country equity markets worldwide since the mid-1990s, substantially weakening the benefits of simple geographic equity diversification.
It seems plausible that financial drivers are similarly weakening other sources of diversification, such that investors must continually seek new sources.
Cautions regarding findings include:
- Sample sizes are not large in terms of secular global economic and political trends (driven, for example, by demographics or major conflicts).
- It is not obvious how the correlations generated by the fairly complex methodology employed in the study translate to practical portfolio diversification benefits.