In reaction to “10-month Versus 40-week Versus 200-day SMA”, a reader inquired whether using measurement intervals of longer than a month to calculate simple moving averages (SMA) would suppress trading compared to monthly intervals and thereby lower trading frictions and improve performance. To check, we compare the performance of simple moving averages based on 12 months (SMA12M), six bi-months (SMA6B) and four quarters (SMA4Q). SMA6B samples six data points bimonthly, with each measurement spanning 11 months. SMA4Q samples four data points quarterly, with each measurement spanning 10 months. Using monthly dividend-adjusted closes for SPDR S&P 500 (SPY) from inception in January 1993 through April 2014 (about 21 years), along with the contemporaneous monthly 3-month Treasury bill (T-bill) yield, we find that:
For this contest, we make the following rules/assumptions:
- Buy (sell) SPY at the close when it crosses above (below) its SMA, slightly anticipating signals such that trades occur at the close on the day of the signal (calculations occur just before the close).
- Cash earns the contemporaneous T-bill yield.
- Consider three sequential monthly start dates to mitigate the possibility of especially lucky starts for SMA6B and SMA4Q
- Test sensitivity to one-way trading (switching between SPY and T-bills) frictions ranging from 0.0% to 1.0%, with focus on a baseline 0.1%.
- Ignore dividend reinvestment frictions and tax implications of trading.
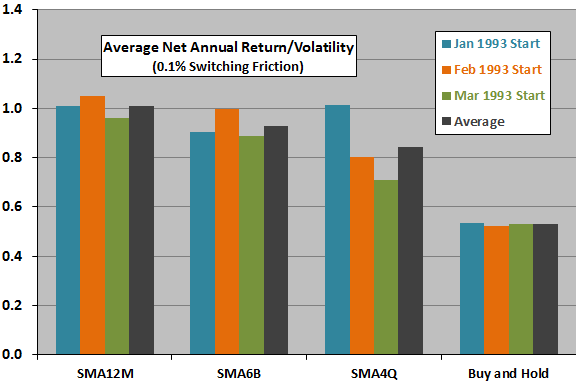
The following chart summarizes average net annual return divided by standard deviation of annual returns (return/volatility) for the three timing rules and for buying and holding SPY applied to samples starting in January, February or March 1993, and the average return/volatility across the three start dates. SMAs beat buy-and-hold for all combinations of rules and start dates. In general, using an SMA12M works better than SMA6B and SMA4Q.
SMA12M, SMA6B and SMA4Q rules are in SPY 75%, 76% and 74% of the time averaged across the three starting months, respectively.
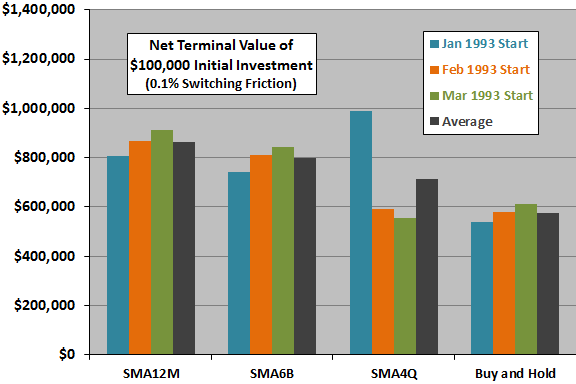
The January 1993 starting date for SMA4Q appears to be especially lucky, because the rule: (1) rides out the August 1998 crash and so does not miss the rebound; and, (2) rides out May-August 2010 sharp decline and so does not miss the rebound.
For another perspective, we look at terminal values of equal investments.

The next chart summarizes average net terminal values for the three timing rules and for buying and holding SPY applied to samples starting in January, February or March 1993, and the average net terminal values across the three start dates. SMAs beat buy-and-hold for 11 of 12 combinations of rules and start dates. In general, using an SMA12M again works better than SMA6B and SMA4Q.
How often do the three rules switch between SPY and cash?

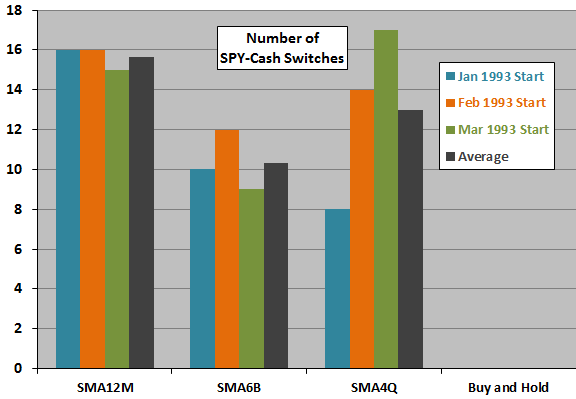
The next chart summarizes number of SPY-cash switches for the three timing rules applied to samples starting in January, February or March 1993, and the average number of switches across the three start dates. While both SMA6B and SMA4Q trade on average less frequently than SMA12M, SMA4Q does not trade less frequently than SMA6B.
What happens when we vary the assumed level of switching friction?

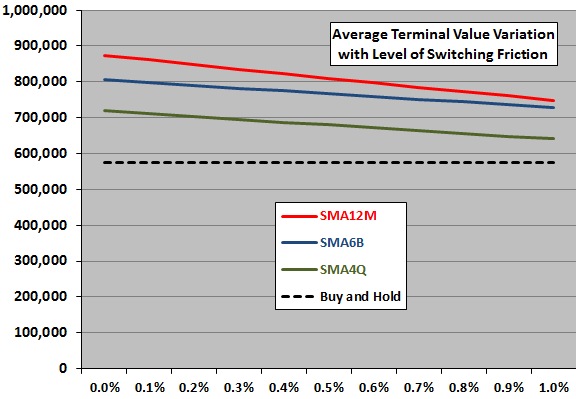
The final chart shows how terminal values of the three SMA rules (averages across the three start dates) vary as the assumed level of switching friction ranges from 0.0% to 1.0% in increments of 0.1%. While SMA12M degrades more rapidly than SMA6B and SMA4Q, it is still wins across the entire range of frictions considered. SMA6B wins for switching frictions above about 0.015%.

In summary, evidence from simple tests does not support belief that an SMA timing rule based on bimonthly or quarterly measurements outperforms a rule based on monthly measurements when applied to the broad U.S. stock market over the past 21 years.
Cautions regarding findings include:
- The sample period is very short in terms of number of bear markets, which drives SMA performance. Instability of SMA4Q rule performance emphasizes this caution.
- See the discussion at the end of “10-month Versus 40-week Versus 200-day SMA”.