Does the S&P 500 Implied Volatility Index (VIX) measured at a monthly interval usefully predict stock market returns? To check, we consider four relationships:
- S&P 500 Depository Receipts (SPY) next-month return versus VIX monthly close.
- SPY next-month return versus VIX monthly range, a measure of the volatility of implied volatility.
- SPY next-month return versus product of VIX monthly change and SPY monthly return (to explore implications of VIX and SPY moving in opposite or same directions).
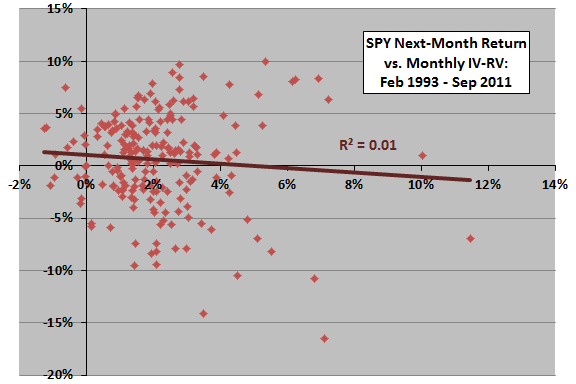
- SPY next-month return versus monthly difference between SPY implied volatility (IV, measured by VIX) and realized volatility (RV, measured by the standard deviation of monthly SPY returns over the past 12 months), as a crude measure of the volatility risk premium.
For VIX calculations, we “de-annualize” by dividing by the square root of 12. For VIX range and change calculations, we use raw VIX numbers. Using monthly high, lows and closes of VIX and monthly dividend-adjusted closes of SPY from January 1993 through September 2011, we find that:
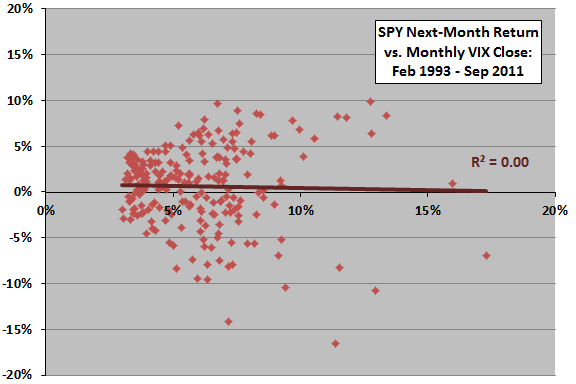
The following chart relates SPY next-month return to lagged monthly VIX close over the available sample period. The Pearson correlation for the is -0.03 and the R-squared statistic 0.00, indicating no relationship. Both good and bad next months for SPY clearly fall across the range of VIX data.
How about lagged VIX monthly range?
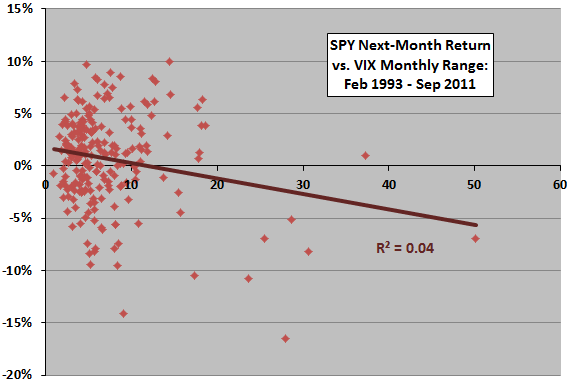
The next chart relates SPY next-month return to VIX monthly range (high minus low) over the available sample period. The Pearson correlation is -0.20 and the R-squared statistic 0.04, indicating the volatility of VIX during a month explains 4% of next-month SPY return. Very large VIX monthly ranges relate mostly to poor future stock market returns. However, excluding a single extreme observation reduces R-squared from 0.04 to 0.02.
How about the combination of lagged VIX change and SPY return?
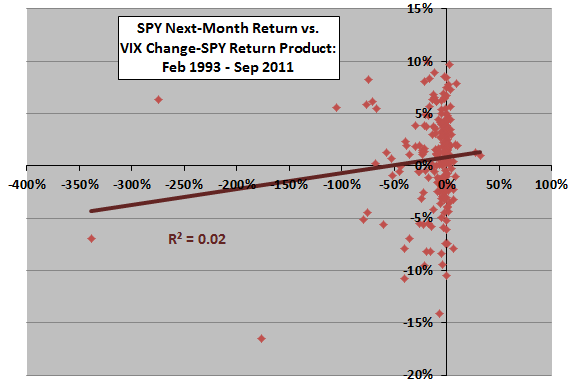
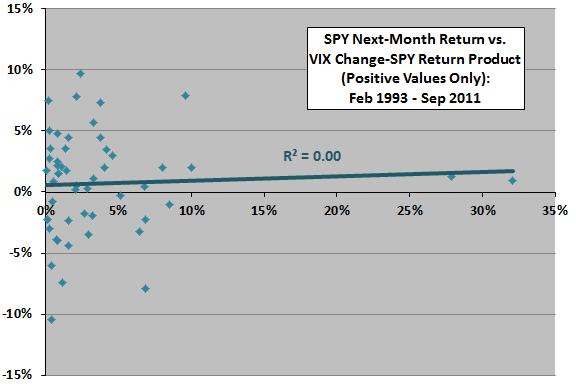
The next two charts relate SPY next-month return to the lagged product of VIX monthly change and SPY monthly return. This product is positive whenever VIX uncharacteristically rises (falls) while the SPY return is positive (negative).
The upper chart considers the entire sample. The Pearson correlation is 0.12 and the R-squared statistic 0.02, indicating the combination of VIX change and SPY return during a month explains 2% of next-month SPY return. However, excluding a single extreme observation changes R-squared to 0.00.
The lower chart considers only the observations for which VIX moves in an unexpected direction based on SPY return. The Pearson correlation is 0.05 and the R-squared statistic 0.00, indicating no relationship.
How about IV minus RV?
The next chart relates SPY next-month return to monthly IV minus RV over the available sample period. The Pearson correlation is -0.08 and the R-squared statistic 0.01, indicating that IV minus RV explains 1% of next-month SPY return. However, excluding a single extreme observation changes R-squared to 0.00.
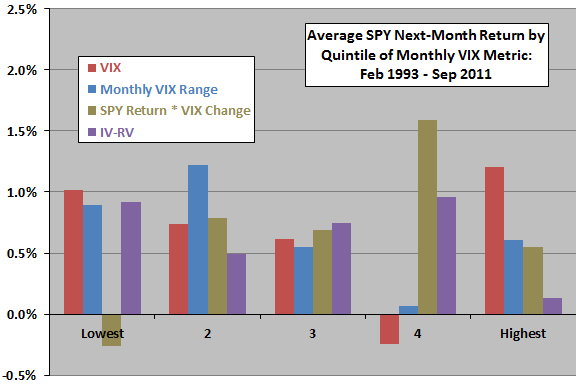
In case these relationships are materially non-linear, we calculate average future stock market returns by rankings of VIX metrics.
The final chart summarizes average SPY next-month return by quintile of ranked VIX monthly metrics over the available sample period. In general, while some metrics exhibit some trend in average future stock market return across quintiles, progressions are not systematic, undermining belief in reliable relationships.
In summary, evidence from simple tests of the usefulness of various VIX monthly metrics for predicting U.S. stock market returns is not compelling.
In those cases where there is some indication of predictive power, extreme events (difficult to exploit quantitatively and emotionally) drive findings.
Cautions regarding findings include:
- More elaborate modeling of VIX influence may discover more convincing predictive power.
- Higher frequency data may uncover more convincing predictive power.
- However, proliferation of models and parameter settings carries data snooping bias (luck) that may be difficult to distinguish from reliable predictive power.
- The above analyses are in-sample, based on entire data sets. An investor operating in real time using only historical data may have drawn different conclusions.