Do relatively high trading frictions in the least developed equity markets offset associated diversification benefits? In the October 2011 version of their paper entitled “Frontier Market Diversification and Transaction Costs”, Ben Marshall, Nhut Nguyen and Nuttawat Visaltanachoti examine this trade-off in 19 frontier stock markets (Argentina, Bahrain, Bulgaria, Croatia, Estonia, Jordan, Kuwait, Lebanon, Lithuania, Oman, Pakistan, Qatar, Romania, Serbia, Slovenia, Sri Lanka, the United Arab Emirates, Ukraine and Vietnam). They first calculate each month a market capitalization-weighted stock index for each country and then combine country indexes to calculate each month both value-weighted and equal-weighted frontier market indexes. They measure trading frictions such as effective spread, quoted spread and price impact based on monthly averages from high-frequency tick data. Using monthly returns and tick-by-tick trading data for frontier market stocks starting as early as June 2002 for six countries and later for others through 2010, along with contemporaneous benchmark index data, they find that:
- Over the sample period, average frontier market returns exceed those of emerging markets and are up to three times greater than those of developed markets and the U.S. Moreover, frontier markets are roughly 15%-20% less volatile than emerging markets based on standard deviations of value-weighted and equal-weighted monthly returns.
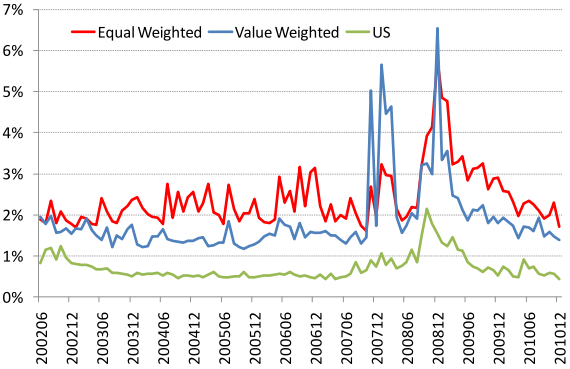
- However, frontier market trading frictions are around three times those for the U.S. stock market (see the chart below).
- Over the entire sample period, because of the low correlations of frontier market returns with those of other equity market groups, frontier market trading frictions do not nullify diversification benefits. Adding frontier market indexes to other group indexes increases average portfolio net Sharpe ratio. This result generally holds even when debiting the largest, rather than the average, monthly trading friction from returns for each frontier market stock and when including reasonable estimates of broker commissions (from another study).
- Value-weighted (equal-weighted) frontier market index return correlations with other group indexes range from 0.53 to 0.57 (0.62 to 0.72).
- By comparison, the return correlation between emerging market and developed (U.S.) market indexes is 0.90 (0.86).
- During the June 2002 through August 2008 pre-crisis subperiod, correlations between frontier market and other group indexes are substantially lower, with frontier market diversification especially effective. Since August 2008, frontier market diversification benefits disappear, with a U.S.-only portfolio generating a higher Sharpe ratio than those with frontier market exposure.
- Average monthly trading volume in each frontier market exceeds $4.4 billion, many times the trading volume of any frontier market fund, indicating that direct investment may be necessary for investors seeking substantial exposure to frontier markets.
The following chart, taken from the paper, compares average equal-weighted and value-weighted frontier market effective bid-ask spreads (essentially twice the execution price minus the bid-ask midpoint) with approximately comparable U.S. trading friction from another study. For the frontier markets, monthly average effective spreads derive from: (1) value-weighting observations for each stock; (2) aggregating stocks by country monthly based on market capitalization weighting; and, (3) aggregating countries based on either equal weighting or market valuation weighting. The average effective spread for the U.S. stock market over the sample period is 0.72%, compared to 2.6% and 1.9% for frontier market equal and value weightings, respectively. Both U.S. and frontier market spreads increase dramatically in late 2008 as the global financial crisis intensified.

In summary, evidence indicates that the diversification benefits of direct holdings of frontier market stocks more than offset the relatively high costs of trading them.
Note that the sample period may be modest relative to potential global economic trends/disruptions.