What is the state of momentum investing? In their January 2011 paper entitled “Momentum”, Narasimhan Jegadeesh and Sheridan Titman summarize equity price momentum research and discuss explanations for the momentum anomaly. Specifically, they address equity momentum investing performance during 1990 through 2009, and the firm characteristics and market conditions that affect momentum returns. Based on a review of momentum research since 1990, their key points are:
- Considerable evidence indicates that stocks performing well (poorly) during the past three to 12 months tend to perform well (poorly) over the next three to 12 months. (See the chart below.)
- A hedge portfolio that buys (shorts) the tenth of U.S. stocks with the highest (lowest) returns over the interval from seven months ago to one month ago and holds for six months is on average profitable before trading frictions in every five-year period starting in 1965 through 2003.
- However, average gross profit for this strategy in the five-year period starting in 2004 is negative, driven mainly by extremely negative returns in 2009.
- Momentum strategies tend to be profitable at a gross level in most large stock markets, with Japan a notable exception. Some research suggests that markets in countries with more individualistic cultures exhibit stronger momentum.
- Momentum strategies tend to earn negative gross returns in January, but significantly positive gross returns in every other calendar month.
- Individual stocks (industries) appear to have negative (positive) serial correlation in portfolio returns, such that the associated momentum strategy should (should not) include a skip between the ranking interval and portfolio formation.
- There is generally some reversion of momentum profits for holding intervals longer than 12 months.
- Various studies find that momentum tends to be stronger:
- For stocks with sparse analyst coverage, high book-to-market ratio, high dispersion in analyst earnings forecasts, high return volatility, high cash flow volatility, high revenue volatility, high turnover and low credit rating.
- After recent periods of low market volatility and during times of strong investor sentiment.
- Similarly, stocks with strong earnings momentum tend to outperform stocks with low earnings momentum.
- Most evidence suggests that momentum derives from a delayed reaction (or overreaction) to firm specific information.
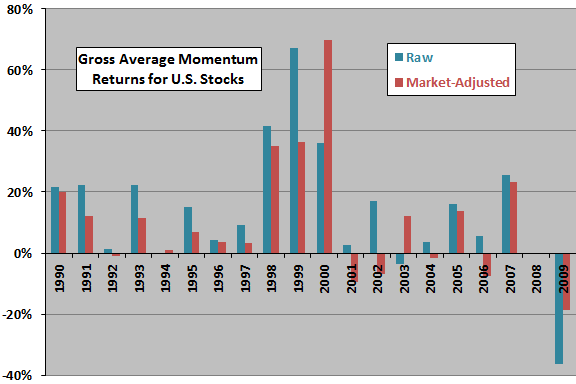
The following chart, constructed from data in the paper, summarizes average gross raw and market-adjusted returns by calendar year for a momentum strategy that each month buys (sells) winning (losing) stocks based on cumulative returns from seven months ago to two months ago (six-month past return with skip-month) and holds the resulting equally weighted, overlapping portfolios for six months.
The strategy generates a gross average profit in 16 out of the 20 years. The average annual gross profit is 13.5%, but with a severe loss of 36.5% in 2009. The poor performance of momentum investing in 2009 may be due to a confluence of unusual (1933-like) market conditions unfavorable to momentum.

In summary, the preponderance of evidence indicates that stock price momentum is a fairly pervasive consequence of delayed investor reaction and is usually exploitable at a gross level, with various firm/stock and economic/market conditions enhancing or suppessing its strength.
Cautions regarding findings include:
- Return calculations are gross, not net. Including reasonable trading frictions, which may be highest for the stocks contributing most to momentum portfolio performance, would reduce reported returns materially. (See, for example, “Trading Friction as a Momentum Killer”.)
- The overlapping portfolio approach (monthly formation with six-month holding interval) may be unrealistic with respect to practice.
- The arguably unusual economic/market conditions of 1998-2000 contribute substantially to momentum strategy gross performance.