Are financial market returns from extreme outlier days mostly good or bad for investors? Is the occurrence of such days usefully predictable? In his August 2011 paper entitled “Where the Black Swans Hide & The 10 Best Days Myth”, Mebane Faber examines the effects and predictability of daily market return outliers. Using daily returns for the broad U.S. stock market for September 1928 through December 2010 and shorter samples through 2010 for 15 other country stock markets (as in “The (Worldwide) Futility of Market Timing?”), he finds that:
- Excluding the best (worst) 1% of all daily returns for the broad U.S. stock market over the entire sample period decreases (increases) annualized return from 4.86% for buy-and-hold to a gross -7.08% (19.1%). Excluding both best and worst days results in a gross annualized return that beats buy-and-hold.
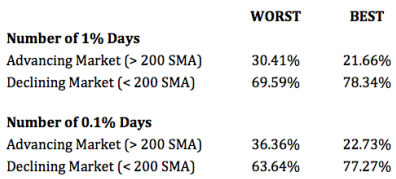
- About 60% to 80% of the best and worst days occur while the market is under its 200-day simple moving average (SMA). (See the table below.)
- Excluding the ten best and ten worst days in every one of 15 non-U.S. country stock markets over available sample periods results in gross compound returns higher than associated buy-and-hold returns. On average across these 15 markets, 76% (67%) of these worst (best) days occur when respective markets are under their 200-day SMAs.
The following table, taken from the paper, summarizes the frequencies of extreme worst and best daily return outliers for the broad U.S. stock market while above and below its 200-day SMA during September 1928 through 2010. Results show that extreme days occur mostly when the market is below its 200-day SMA.

In summary, evidence from simple tests suggest that investors can beat a broad equity market buy-and-hold approach by staying out of the market while it is below its 200-day SMA.
Cautions regarding findings include:
- Analysis is in-sample, utilizing entire data sets. An investor operating in real time would likely identify “extreme outliers” differently at different points in time based on evolving available data. See “Day After Big Down Days” and “Day After Big Up Days” for an approach to identifying extreme daily returns based strictly on past data.
- Simple moving averages crossovers and crossunders may not be reliably effective over time and across asset classes/subclasses in specifying market return volatility regimes. See “Technical Trend-following: Fighting the Last War?”, “Use ‘Standard’ SMAs to Identify Gold Market Regimes?” and “SMA Signal Effectiveness Across ETFs”.
- Return calculations are gross, not net. Incorporating realistic trading frictions would reduce returns for any scenarios that involve trading in and out of stocks. Trading frictions vary considerably over the long run and were very high during much of the U.S. stock market sample period.