Are January returns important to the profitability of short-term reversal, intermediate-term momentum, long-term reversion and 12-month echo trading strategies? In her December 2010 paper entitled “Momentum, Seasonality and January”, Yaqiong Yao investigates the role of January returns within these previously discovered anomalies. The study’s core methodology is to reform equally weighted hedge portfolios each month that are long/short stocks in extreme tenths (deciles) of past returns over various intervals. The one-month reversal strategy is long (short) losers (winners) based on prior month returns. Momentum strategies are long (short) winners (losers) based on past 11-month or 12-month returns, with a skip month before portfolio formation to avoid short-term reversal. The reversion strategy is long (short) losers (winners) based on past four-year returns, with a skip-year before portfolio formation to avoid intermediate-term momentum. The 12-month echo strategy is long (short) winners (losers) based on returns for the same month the prior one, two or three years. Using monthly returns for a broad sample of NYSE/AMEX stocks during 1926 through 2009, she finds that:
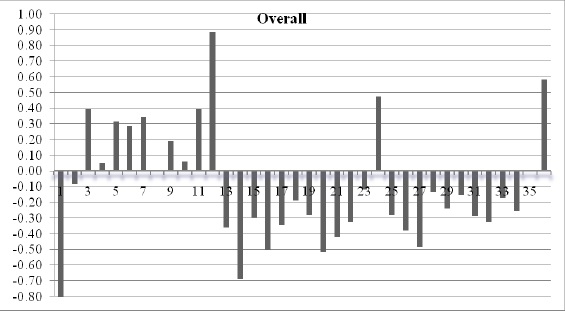
- Past month winners underperform past month losers by an average 3.99% per month gross, supporting incorporation of a skip-month in momentum strategies.
- The 12-month echo (same month last year) drives the finding in prior research that past months 7-12 contribute more to the momentum effect than past months 2-6. The 12-month echo for January is especially influential. Gross momentum profitability tends to disappear during bear markets. The paper offers finer parsing of gross momentum performance by calendar month.
- There is gross long-term reversion from returns of past months 13-23 months and 25-35 months, but the 12-month echoes of past months 24 and 36 work against reversion.
- Trading on 12-month echo generates average monthly gross returns of 0.88%, 0.47% and 0.58% based on returns for past months 12, 24 and 36, respectively. This effect is stronger in the second half of the sample period than the first, is exceptionally strong for January (due most to outperformance of past winners) and tends to persist through bear markets.
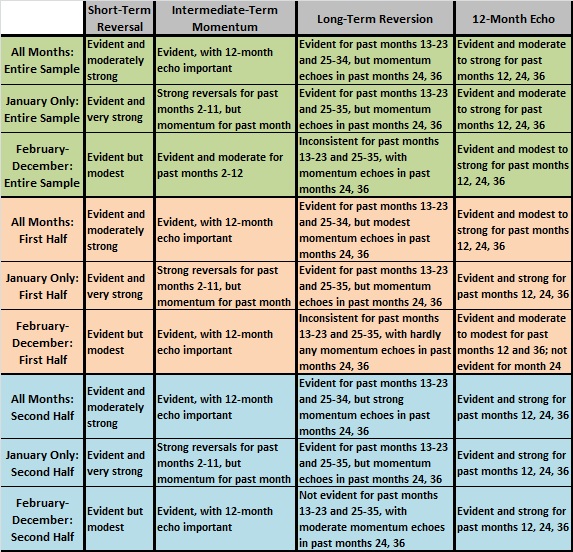
- The relationship between current month return and past monthly returns is in some cases decisively different for January in comparison to February-December (see the table below). For example,
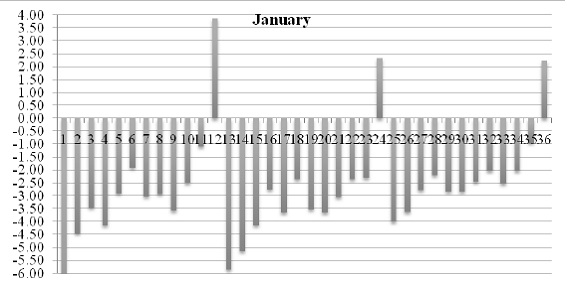
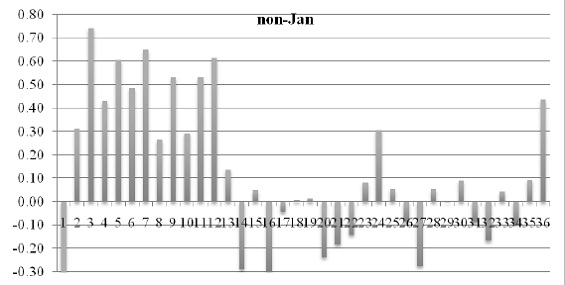
- January exhibits substantial reversion of returns relative to past months 2-11, while February-December exhibits momentum. In other words, momentum consistently does not exist in January.
- January exhibits notable reversion for past months 13-23 and 25-35, while February-December does not. In other words, long-term reversion is essentially a January effect over the entire sample period and two equal subperiods.
- A combination strategy that exploits the 12-month echo in January and momentum during February-December (excluding as much of bear markets as identifiable) appears particularly attractive.
The following table summarizes study findings for all four anomalies over the entire sample period (rows 1-3), the first half of the sample period (rows 4-6) and the second half of the sample period (rows 7-9). Summary findings derive essentially from interpretation of the graphs below for the overall sample period and from similar graphs for the first and second halves of the sample period in the paper.

The following charts, taken from the paper, summarize average returns for equally weighted hedge portfolios that are long (short) the tenth of stocks with the highest (lowest) past returns in each of the past 36 months, formed monthly over the entire sample period, as follows:
- The top chart (Overall) shows average returns for portfolios formed in all months across the sample period.
- The middle chart (January) shows average returns only for portfolios formed in January to see whether past return relationships are markedly different for January.
- The bottom chart (non-Jan) shows average returns for portfolios formed in all months except January to confirm whether past return relationships are markedly different for January.
The table above interprets results in the contexts of previously discovered reversal, momentum, reversion and 12-month echo anomalies.


In summary, investors may be able to refine and combine short-term reversal, intermediate-term momentum, long-term reversion and 12-month echo trading strategies by considering their sometimes unusual behaviors in January compared to the balance of the year.
Reasons to be cautious about the findings include:
- All study calculations employ gross returns, whereas small and relatively illiquid stocks (with high trading frictions) may drive conclusions. Findings based on realistic net returns may be materially different.
- Finer analysis of time variation than first half/second half may expose market adaptation (material weakening of anomalies after discovery/publication).
- Strategies based on findings may be sensitive to variation in trade execution timing around the turns of months.
- This research carries the unquantifiable baggage of any data snooping bias impounded in the original research on return reversal, momentum, reversion and 12-month echo.
- The detailed parsings of momentum, reversion, 12-month echo, calendar month, subperiod and market conditions explored in the paper carry incremental and potentially material data snooping bias.