Does combining avoidance of fat tail losses with a traditional portfolio optimization strategy enhance performance? In her January 2011 paper entitled “The Economic Value of Controlling for Large Losses in Portfolio Selection”, Alexandra Dias investigates the effectiveness of combining tail loss risk management with minimum variance efficiency. This approach essentially seeks to add avoidance of Black Swans to the benefit of diversification. The investigation consists of testing four long-only strategies using 224 months of rolling historical returns on all possible combinations of three Dow Jones Industrial Average (DJIA) stocks by choosing each month: (1) the minimum variance portfolio with the smallest variance (benchmark strategy); (2) the minimum variance portfolio with the smallest probability of a large loss; (3) the minimum variance portfolio with the thinnest losses tail; and, (4) the minimum Value at Risk (VaR) portfolio with the smallest VaR. Strategies (2), (3) and (4) are alternatives for managing return distribution tail risk. Using monthly returns for the 24 DJIA stocks for which which prices are available during February 1973 through June 2010 (allowing 2,024 combinations of three stocks), she finds that:
Note that the minimum variance (VaR) portfolio for each combination of three DJIA stocks assigns portfolio weights to the stocks that minimize variance (VaR) over the current rolling historical window. Use of minimum variance portfolios encapsulates traditional risk reduction and therefore helps isolate the incremental benefits of other strategies.
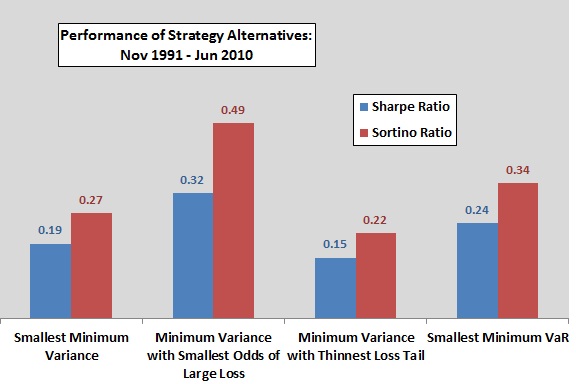
- Strategy (2) based on the minimum variance portfolio with the smallest probability of a large loss has the best gross risk-adjusted performance based on Sharpe ratio and Sortino ratio with the yield on one-month U.S. Treasury bills as the risk-free rate (see the chart below).
- Strategy (4) based on smallest minimum VaR has the second best gross risk-adjusted performance.
- However, strategy (2) has the highest portfolio turnover and therefore highest cumulative trading frictions. Strategies (4) and (1) have the lowest turnover rates.
- Results are robust to a constant 0.2% one-way level of trading frictions (fees, commissions and bid-ask spreads), indicating net outperformance in the range 0.24% to 0.49% per year for strategy (4) over benchmark strategy (1).
The following chart, constructed from data in the paper, compares gross Sharpe ratios and Sortino ratios for the four strategies described above over the entire testing period. Results indicate that minimizing the probability of a large loss based on historical data may be an effective way to add tail risk management to traditional methods.
However, the strategy with the best gross performance also generates the highest portfolio turnover.

In summary, investors may be able to enhance risk-adjusted performance by avoiding portfolio alternatives with relatively high historical probabilities of large losses.
This research addresses the question “How Can You Avoid the Fat Left Tails?” and provides some quantification of “Surviving by Staying Out of the Fourth Quadrant”.
Reasons to be cautious about the findings include:
- The methods are likely too complex for many investors (but simplified versions may have benefits).
- The net enhancement is small.
- In assessing robustness to trading frictions, the paper applies a constant 0.2% level of trading frictions to strategy turnover rates. Findings may be sensitive to this assumed level.
- Moreover, even over the post-1990 trading period in the study, trading frictions vary considerably (see “Trading Frictions Over the Long Run”). Incorporation of realistic, time-varying trading frictions could alter findings.