Does the concept of an idealized fixed business cycle help predict stock market returns? In his recent paper entitled “Forecasting 2011 Using U.S. Precedents: A Simple Analysis of Equity Market Performance”, Thomas Hall examines the performance of major U.S. stock market indexes at fixed intervals after business cycle troughs and extrapolates results to predict U.S. stock market returns for 2011. For extrapolation, he employs a regression relating returns during months 19-30 after business cycle troughs (equating to calendar year 2011 for the most recent trough) to returns during the immediately preceding months 1-18 after troughs. Using National Bureau of Economic Research business cycle trough months and monthly closes of the Dow Jones Industrial Average and the S&P 500 Index for trough months and months 19 and 30 after troughs as available since 1926 (14 and eight troughs before June 2009, respectively), he finds that:
- The relationship between returns during months 1-18 after recession troughs and returns during the ensuing months 19-30 is:
- Slightly inverse for the entire DJIA sample (14 observations), with Pearson correlation -0.12.
- Much more strongly inverse for DJIA since 1958 and for the contemporaneous S&P 500 Index sample (eight observations), with Pearson correlations -.91 and -.81, respectively.
- These results suggest reversion of month 1-18 returns during ensuing month 19-30 intervals.
- Using only the recent (since 1958) data for extrapolation indicates poor 2011 returns for DJIA and the S&P 500 Index of -12% and -8.5%, respectively, because returns for July 2009 through December 2010 are so strong.
The paper also presents average industry-level returns for months 19-30 after recession troughs for the past two business cycles.
In summary, evidence from simple regressions of U.S. stock market returns comparing months 1-18 to months 19-30 after business cycle troughs suggests that 2011 will be a bad year for U.S. stock markets.
Reasons to be cautious regarding this forecast include:
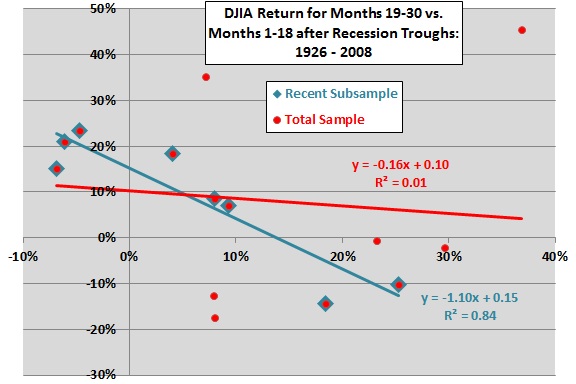
- There is no analysis to support the argument in the paper that pre-1958 economic and stock market conditions are so different from “modern” conditions that they should be ignored. Another perspective is that ignoring older data (which, in fact, indicates a moderately positive relationship between months 1-18 returns and months 19-30 returns) introduces data snooping bias, which is especially pernicious for small samples (see the chart below).
- Moreover, economic and stock market conditions continue to evolve, such that relationships holding for 1958-2008 (which did not hold for 1926-1957) may not persist.
- The times between recession troughs range from 2.3 years to 10.7 years over the entire DJIA sample, undermining belief that calculating economic activity or stock market returns over fixed intervals relative to a business cycle milestone is meaningful.
- Statistical significance calculations in the paper assume normality of stock market return distributions.
The following chart, constructed from data in the paper, compares best-fit linear relationships between DJIA returns for months 19-30 after business cycle troughs to returns for months 1-18 for the entire sample (14 red circles) and for the subsample since 1958 (eight blue diamonds). The chart includes the formulas for both best-fit lines and R-squared statistics for the entire sample and the recent subsample. Note that:
- The formulas for the two best-fit lines are very different. Extrapolation to the current recession trough using the entire sample indicates a 2011 DJIA return of +6.2%.
- For the entire sample, the R-squared statistic is only 0.01, indicating that variation in the returns for months 1-18 explains only 1% of the variation in returns for months 19-30. In other words, confidence in any extrapolation to the current recession trough using the entire sample is extremely low.
