Are there stock/firm characteristics that usefully predict which stocks will exhibit extreme returns? In their January 2011 paper entitled “Predicting Extreme Returns and Portfolio Management Implications”, Kevin Krieger, Andy Fodor, Nathan Mauck and Greg Stevenson investigate the predictability of extreme returns for individual stocks and the practical import of such predictability for investment portfolios. The define stocks with extreme returns by year as those within the highest 3% or lowest 2.5% of equity returns, or those delisted for bankruptcy or bankruptcy-like reasons. Using implied volatility, stock price/return, trading volume, firm age, accounting and analyst forecast data for the period is 1996 through 2008 (1,100 to 1,500 firms per year with sufficient data), they find that:
- A relatively high option-implied volatility is the most consistent and powerful predictor of extreme stock returns over the next year.
- Firm age (time listed) and market capitalization (size) have incremental predictive power, with relatively young and small firms more likely to exhibit extreme future returns.
- A multivariate probit model applied to lagged data has the following success rates in predicting extreme return stocks for 2008:
- Of the 80 stocks predicted to exhibit extreme returns, 12 actually do (15% success rate).
- Of the 92 stocks that actually exhibit extreme returns, the model predicts 12 (13% recognition rate).
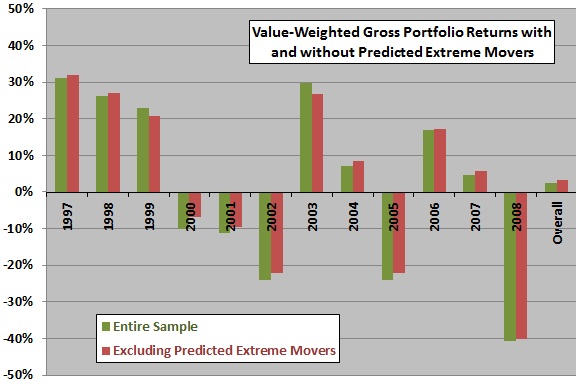
- For the overall sample period and for 10 of 12 years in the sample period, a value-weighted portfolio that excludes stocks predicted to have extreme returns has lower daily volatilities and higher gross returns than a portfolio that includes them (see the chart below). For example, over the the entire sample period, a portfolio that excludes (includes) predicted extreme movers has a 3.19% (2.39%) cumulative gross return with annualized daily standard deviation of 25.6% (27.8%).
- Results are generally robust to different thresholds for extreme returns.
The following chart, constructed from data in the paper, compares the annual and cumulative gross returns for value-weighted portfolios of the full sample of stocks and a sample excluding predicted extreme movers. The trimmed portfolio outperforms the full sample in 10 of 12 years and overall. While the degree of gross outperformance is not economically compelling, excluding predicted extreme movers would probably reduce portfolio formation costs both by reducing the number of holdings and avoiding stocks that are likely to have high trading frictions.

In summary, investors with broadly diversified portfolios may want to evaluate enhancement of risk-adjusted net returns by screening out stocks with the highest implied volatilities (especially those of young and small firms).
This finding suggests screening stocks based on other volatility-associated variables, such as trading friction.