A reader commented and asked: “Several of my friends swear by the McClellan Summation Index for timing medium term bull/bear moves. Have you any evaluation of its usefulness?” The McClellan Summation Index derives from the McClellan Oscillator, a technical indicator developed in 1969 by Sherman and Marian McClellan, for which the daily input is the number of stocks that closed higher (advances) minus the number that closed lower (declines). The McClellan Oscillator smooths and seeks to concentrate the information in this daily breadth input stream via the difference of two exponential moving averages. The McClellan Summation Index is a running total of the daily values of the McClellan Oscillator. McClellan Financial Publications describes how to calculate the McClellan Oscillator. Advances and Declines is a public source of the historical numbers of advances and declines for U.S. exchanges. Using the daily numbers of NYSE advances and declines for March 1965 through most of June 2012 and daily dividend-adjusted closes of SPDR S&P 500 (SPY) from the end of January 1993 through most of June 2012 (about 19.5 years), we find that:
In setting up the calculations for the McClellan Oscillator and McClellan Summation Index, we make the following assumptions and corrections:
- NYSE data from Advances and Declines for 11/26/99 are missing. We ignore that date.
- There are entries in the NYSE data from Advances and Declines that fall on market holidays. These entries appear to be duplicates or post-close revisions of data from the preceding trading day. We ignore the holiday entries.
- There are very minor differences in the numbers of advances and declines between the data from Advances and Declines and the recent sample from McClellan Financial Publications. These differences may stem from post-close revisions. We accept the data from Advances and Declines. Correlations between our calculations of the McClellan Oscillator and the McClellan Summation index with the recent sample from McClellan are 1.00 and 1.00, respectively, with average daily differences -0.53 and 4.90.
- The value of the McClellan Summation Index depends on the calculation start date. We calibrate the index by taking its 6/20/12 value as calculated by McClellan Financial Publications and then step backwards over the sample period.
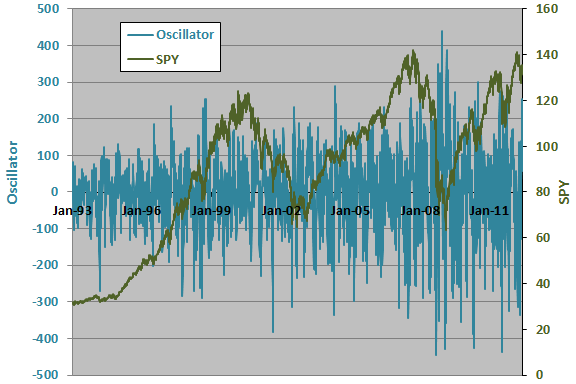
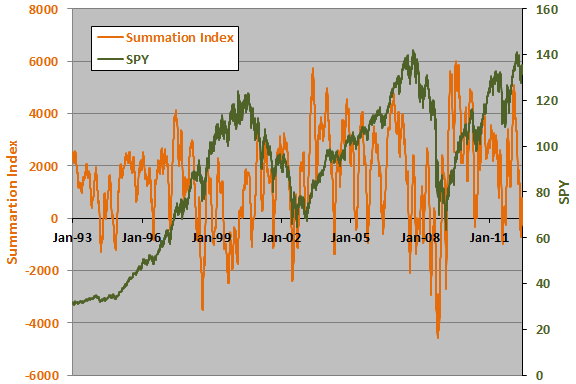
The following two charts show the evolutions of the McClellan Oscillator and SPY (upper chart) and the McClellan Summation Index and SPY (lower chart) over the available sample period. Visual inspection reveals no obvious reliable relationships for the two pairs of series.
For precision we relate the McClellan indicators to future SPY returns.
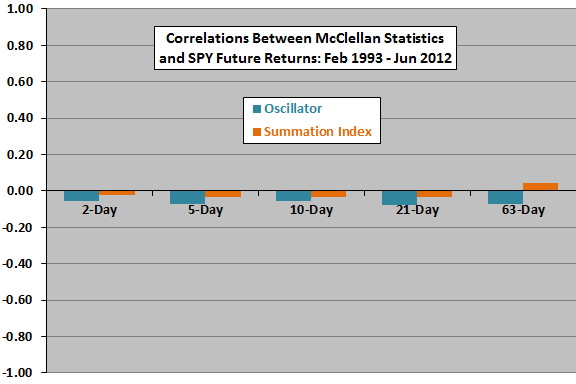
The next chart summarizes Pearson correlations between the McClellan Oscillator and the McClellan Summation Index and returns for SPY during future intervals of 2, 5, 10, 21 and 63 trading days over the available SPY sample period. All correlations are very small, and all are negative except for that between the McClellan Summation Index and the SPY 63-day future return.
For a closer look at the McClellan Oscillator, we focus on the SPY 5-day (one week) future return.
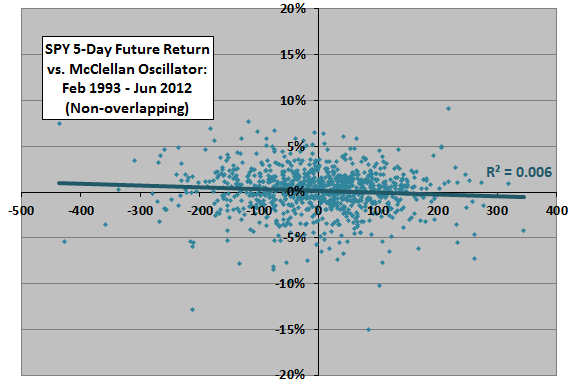
The following scatter plot relates the SPY 5-day future return to the value of the McClellan Oscillator over the available SPY sample period, winnowed to select every fifth observation to ensure independence (976 surviving observations). The Pearson correlation is -0.08 and the R-squared statistic is 0.006, indicating that the McClellan Oscillator explains practically nothing about SPY next-week return.
In case there is a material non-linearity in the relationship, we calculate average SPY next-week return by ranked decile (tenth) of McClellan Oscillator values.
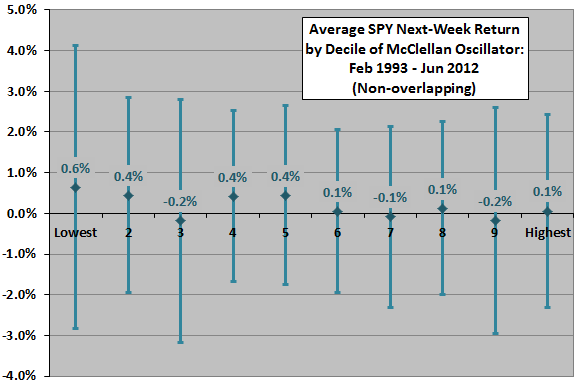
The next chart summarizes average SPY next-week returns by decile of McClellan Oscillator value based on the winnowed data over the available SPY sample period, with one standard deviation variability ranges. Average returns are mostly higher for low deciles than high deciles, but the progression across deciles is not systematic. Also, variabilities of returns are mostly elevated for low deciles. Results offer little support for belief that the McClellan Oscillator reliably predicts future stock market returns.
What if we consider a signaled, rather than fixed, future return interval?
For signaled entry and exit based on the McClellan Oscillator, we consider the following guidance from Decision Point: “When the McClellan Oscillator moves below the Zero Line a SELL Signal is rendered, and a BUY Signal results when it moves above zero…” Applying this guidance to the unwinnowed data over the entire SPY sample period generates 366 buy signals and 367 sell signals. The average duration of the buy (sell) signals is 10 (9) trading days. Assuming trades at the close with the signals (requiring slight anticipation of indicator values), the average return between buy and sell (sell and buy) signals is 0.16% (0.29%), with standard deviation per trade 2.68% (2.34%). In other words, SPY performance from sell to buy is better than that from buy to sell, undermining belief in the usefulness of the McClellan Oscillator signals.
For a closer look at the McClellan Summation Index, we focus on the SPY 63-day (one quarter) future return.
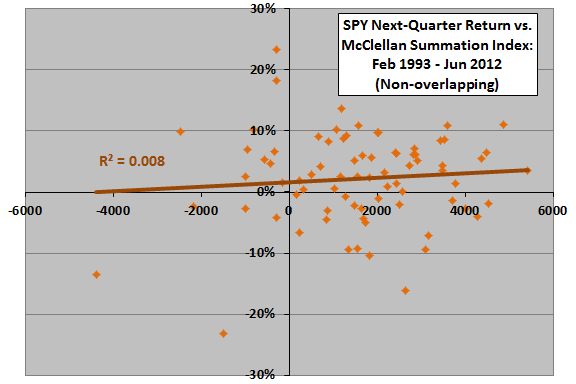
The next scatter plot relates the SPY next-quarter return to the value of the McClellan Summation Index over the available SPY sample period, winnowed to select every 63rd observation to ensure independence (77 surviving observations). The Pearson correlation is 0.09 and the R-squared statistic 0.008, indicating that the McClellan Summation Index explains practically nothing about SPY next-quarter return.
Daily observations overlap considerably, tending to overstate sample size and potentially distorting statistics. Winnowing the data such that no two 63-day future return intervals overlap (only 68 winnowed observations) results in an R-squared statistic of 0.01, indicating that variation in the McClellan Summation Index explains 1% of the variation in the SPY 63-day future return.
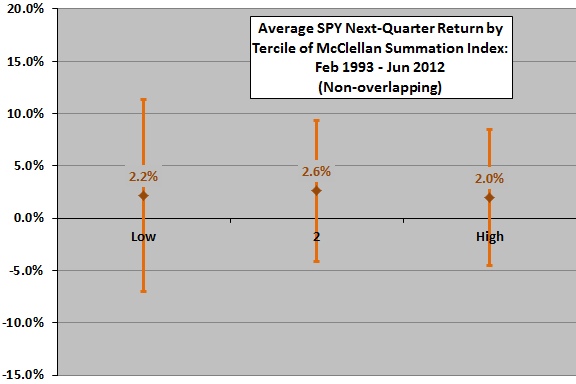
In case there is a material non-linearity in the relationship, we calculate average SPY next-quarter return by ranked tercile (third) of McClellan Summation Index values.
The final chart summarizes average SPY 63-day future return by tercile of McClellan Summation Index value based on winnowed data over the entire SPY sample period, with one standard deviation variability ranges. Results suggest no meaningful differences across terciles. Sample size is small, such that removing a single observation can change the order of the tercile returns.
What if we again consider a signaled, rather than fixed, future return interval?
For signaled entry and exit based on the McClellan Summation Index, we consider the following guidance from Decision Point: “Movement below the Zero Line is considered bearish, while movement above +2000 is considered bullish.” We apply this guidance to the unwinnowed data over the entire SPY sample period based on the following assumptions:
- Since the McClellan Summation Index is above 2000 at the beginning of the sample period, we start with a buy signal at that time.
- The guidance sometimes generates many consecutive daily buy and sell signals. Since repeat signals are not tradable, we assume trading on the first buy or sell signal in any sequence.
Based on these assumptions, there are 20 tradable buy signals and 19 tradable sell signals over the sample period. The average duration of the buy (sell) signals is 237 (122) trading days. Assuming trades at the close with the signals (requiring slight anticipation of indicator values), the average return between buy and sell (sell and buy) signals is 4.2% (5.1%), with standard deviation per trade 16.4% (9.8%). Normalizing to account for the different buy and sell trade durations, the average return per day while on a buy (sell) signal is 0.018% (0.042%). These results undermine belief in the McClellan Summation Index as a useful stock market trading signal.
In summary, evidence from simple tests on available data generally does not support belief that either the McClellan Oscillator or the McClellan Summation Index usefully predict U.S. stock market returns at either fixed or signaled future horizons.
Cautions regarding findings include:
- Analyses are in-sample. A trader operating in real time based strictly on historical data, may select different buy and sell signal thresholds.
- Analyses ignore trading frictions, which would reduce reported returns.
- There may be methods of applying these indicators that do exhibit predictive power, but general failure of these simple tests makes data snooping bias a concern for such methods.