Media commentators and expert advisors sometimes cite cuts and hikes in the Federal Funds Rate (FFR) as an indicator of U.S. stock market prospects, with decreases (increases) in FFR acting as a stimulant (depressant). Does the overall U.S. stock market respond systematically to loosening and tightening of credit as measured by cuts and hikes in FFR? Using FFR target changes and daily S&P 500 Index levels over the period January 1990 through December 2010, encompassing 76 changes in FFR (46 cuts and 31 hikes), we find that:
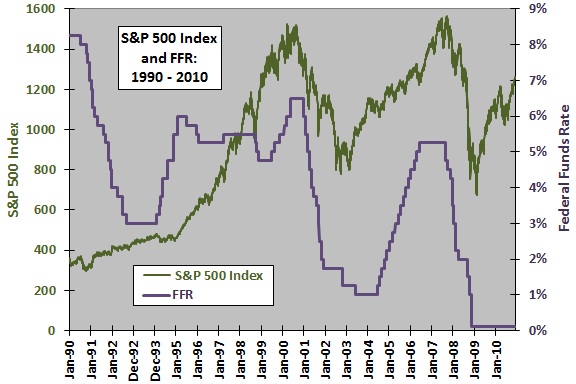
The following chart compares the behaviors of the S&P 500 Index and FFR over the entire sample period. When the Federal Reserve issues a target range rather than a target number, we use the middle of the range (for example, 0.125% for the range 0%-0.25%). The Federal Reserve is active in the credit market. Including the quiet interval of December 2008 through December 2010, the average (median) interval between FFR changes is 98 (48) calendar days. FFR cuts and hikes cluster in loosening and tightening regimes. No consistent relationship between FFR and stocks over any fixed interval is obvious. For example:
- During 1990-1992, stocks advance while FFR falls dramatically.
- During 1995-2000, stocks rise dramatically while FFR changes little.
- During 2000-2002, stocks and FFR fall sharply together.
- During 2003, stocks rise while FFR changes little.
- During 2004-2006, stocks and FFR generally rise together.
- During 2007-2008, stocks and FFR fall dramatically together.
- During 2009-2010, stocks rise while FFR changes little.
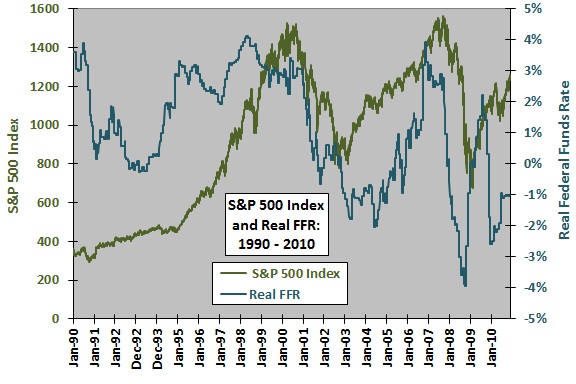
Does the real FFR (adjusted for inflation) interact differently with stocks?
The next chart compares the behaviors of the real FFR (FFR minus the 12-month trailing inflation rate) and the S&P 500 index over the entire sample period. The general subperiod relationships noted above still hold (with 2009 notably different). Again, no consistent relationship is apparent visually.
Are changes in FFR predictive for stock market returns over intervals of a week to six months?
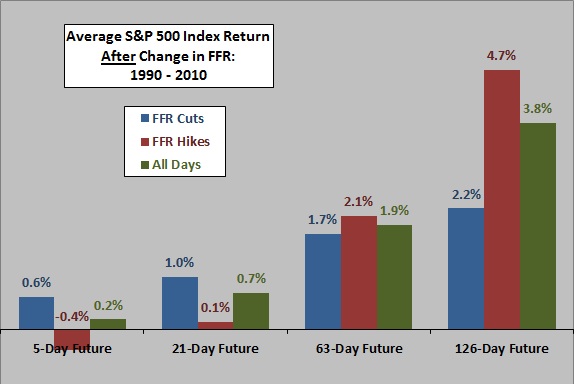
The next chart summarizes average stock market returns over the 5-day, 21-day, 63-day and 126-day intervals (trading days) after FFR cuts and boosts over the entire sample period. Since the Federal Reserve announces FFR changes during the trading day, we calculate S&P 500 Index returns from the close on the day before an FFR change to the close on the last day of the interval. Results suggest that:
- Cuts in FFR (subsample size 46) are modestly bullish over the next week and month but neutral over the next quarter and bearish over the next six months.
- Hikes in FFR (subsample size 31) are somewhat bearish over the next week and month but neutral over the next quarter and perhaps bullish over the next six months.
What about the volatility of stock market reactions to FFR changes?
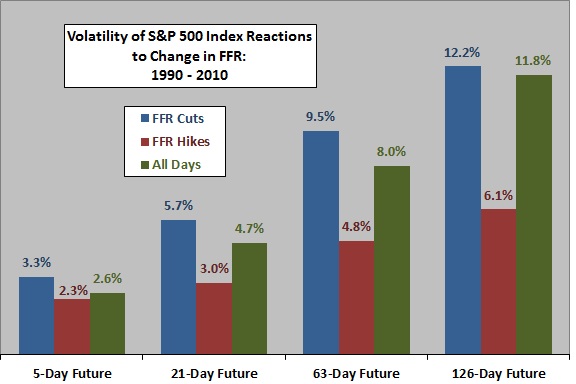
The next chart summarizes volatilities of stock market reactions (standard deviations of interval returns) for 5-day, 21-day, 63-day and 126-day intervals after FFR cuts and boosts over the entire sample period. Again, we calculate S&P 500 Index returns from the close on the day before an FFR change to the close on the last day of the interval. Results suggest that:
- Stock market reactions to rate cuts tend to be more volatile than normal over all four future intervals.
- Stock market reactions to rate hikes tend to be less volatile than normal over all four future intervals.
In other words, reactions to rate cuts tend to be inherently less predictable than reactions to rate hikes. Alternatively, the Federal Reserve tends to cut (hike) FFR during high-volatility (low-volatility) stock market regimes.
Reasons to be cautious about the above findings are:
- Subsample sizes are modest, such that a few more observations might materially alter results. There are not enough observations to test consistency of findings across subperiods.
- Changes in FFR sometimes occur more frequently than 126, 63 or even 21 trading days, resulting in overlapping (non-independent) measurement intervals for subsequent stock returns. Interval overlap reduces effective subsample sizes and may overweight subperiods of very frequent changes in FFR. In other words, results for longer future return intervals are not as reliable as even the modest subsample sizes imply.
- Since the measurement intervals start at the close on the trading days before FFR changes, a trader could not fully exploit depicted anomalies. A sensitivity test that starts measurement intervals at the close on days of FFR changes:
- Eliminates the 5-day and 21-day average return outperformance after rate cuts (in other words, the announcement-day return is decisive), but does not alter the conclusion of underperformance over the next six months.
- Confirms the 5-day and 21-day average return underperformance, and the outperformance over the next six months, after rate hikes.
- Confirms the tendency of stock market reactions to rate cuts (hikes) to be of high (low) volatility.
What about short term returns around dates of FFR changes?
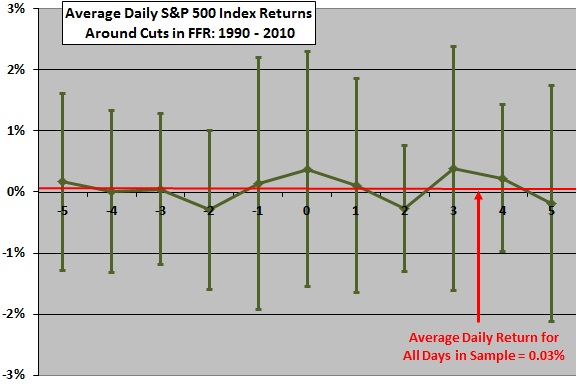
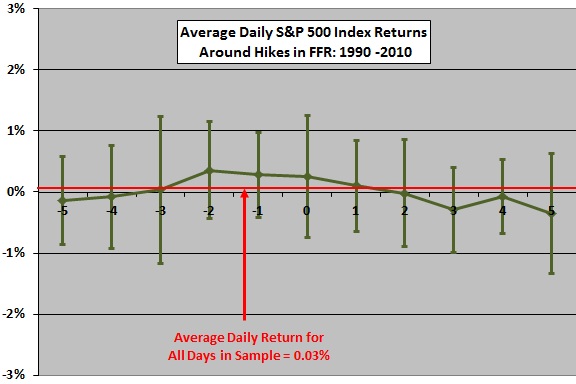
The following two charts show the average daily S&P 500 Index returns from five trading days before through five trading days after announcements of cuts (upper chart) and hikes (lower chart) in FFR over the entire sample period, with one standard deviation variability ranges. The mean daily return for all 5,294 trading days in the sample is 0.03%. Results suggest:
- For rate cuts, there is on average down-up-down-up volatility over the short term, with the announcement date up on average. However, the S&P 500 Index declines on 23 of the 46 announcement dates.
- For rate hikes, there appears to be on average an anticipatory optimism followed by post-announcement reversal. The S&P 500 Index advances on 17 of the 31 announcement dates. On the third trading day after announcements, 20 of 31 returns are negative.
- Stock market behavior around rate cuts tends to be much more volatile than around rate boosts.
As usual for daily data and especially for such small subsample sizes, noise dominates signal such that these visual impressions are risky for trading. Note that this test does not measure response in the context of some otherwise measured investor expectations.
Might the stock market lead FFR changes?
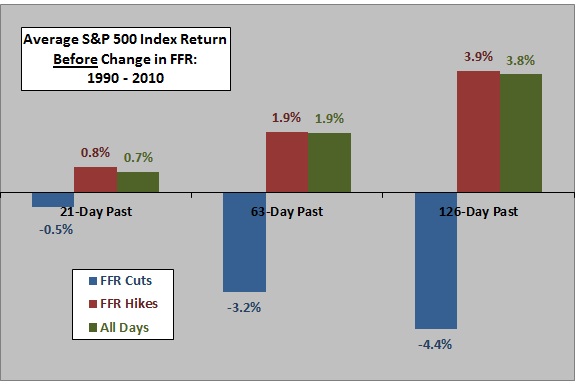
The final chart summarizes average stock market returns over 21-day, 63-day and 126-day intervals (trading days) before cuts and hikes in FFR. We calculate all S&P 500 Index returns from the close on the first day of each interval to the close on the day before the FFR change. Results suggest that:
- Cuts in FFR tend to follow intermediate-term periods of stock market weakness.
- Stock market behavior over the intermediate term before hikes in FFR are not unusual.
A possible interpretation is that investors and the Federal Reserve focus on similar indicators of economic weakness, but that investors act more quickly on bad news than do the central bankers. Again, modest subsample sizes and overlap of measurement intervals limit confidence in conclusions.
In summary, results of simple tests on limited recent data suggest that the immediate stock market reactions to Federal Funds Rate cuts and hikes on average support belief in conventional wisdom, but the effects are small and may not be exploitable. Longer-term reactions appear not to conform to conventional wisdom.