The zero-sum S&P 500 futures/options market involves three groups of traders: (1) commercial hedgers; (2) non-commercial traders (large speculators); and, (3) non-reportable traders (small or retail speculators) representative of the public. The Commodity Futures Trading Commission (CFTC) collects and publishes aggregate positions (short, long and spread) for each group in a weekly Commitment of Traders (COT) report. CFTC releases reports on Fridays for positions as of the preceding Tuesdays. Are the behaviors of these groups in trading S&P 500 index futures/options reliable indicators of future stock market direction? To investigate, we relate weekly S&P 500 Index futures/options short-long ratios for the three trader categories to S&P 500 Index returns. Using historical weekly COT report data for S&P 500 Index futures and options combined and corresponding weekly dividend-adjusted prices for SPDR S&P 500 (SPY) as a tradable proxy for the index during March 1995 (the earliest available COT data) through early September 2012 (912 weeks), we find that:
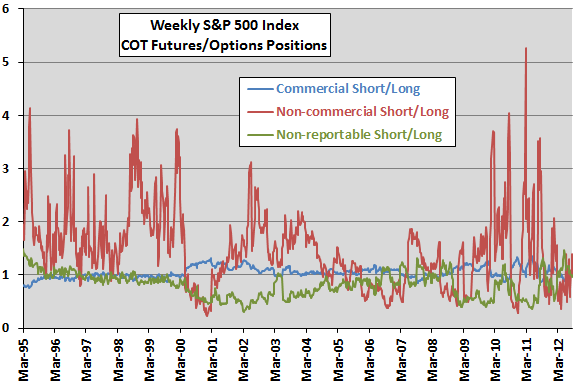
The following chart depicts S&P 500 Index futures/options short-long ratios for the three groups of traders over the entire sample period. It shows that:
The commercial hedgers are on average roughly neutral (mean short-long ratio 1.05), with low volatility (standard deviation 0.10). This group is notably net short during 2000-2002 and late 2008. The group is arguably the most conservative and research-oriented of the three groups.
The non-commercial traders are mostly net short (mean short-long ratio 1.47), and their short-long ratio is very volatile (standard deviation 0.74). The large speculators are perhaps big risk-takers.
The non-reportable traders are mostly net long (mean short-long ratio 0.82 with standard deviation 0.23). This group is perhaps the least likely to have valuable private information.
Speculators tend to trade against commercial hedgers, with Pearson correlations of -0.49 (-0.82) between weekly series of short-long ratios for non-commercial (non-reportable) traders and commercial hedgers.
Do the positions of these groups predict future S&P 500 Index returns?
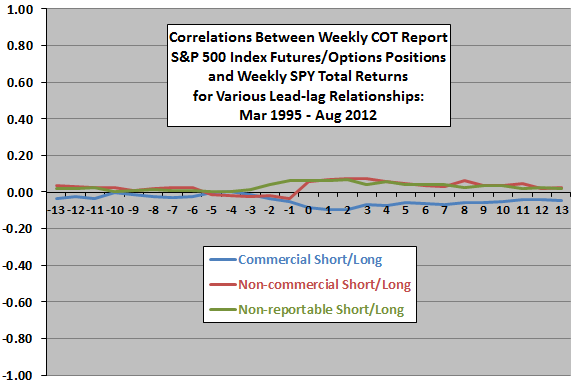
The next chart plots Pearson correlations between weekly COT report futures/options short-long ratios and weekly SPY returns for each of the three groups over the entire sample period for lead-lag relationships ranging from the index leads short-long-ratios by 13 weeks (-13) to short-long ratios lead the index by 13 weeks (13). Week 0 is the week ending with COT report release. Results indicate that:
The aggregate behavior of commercial hedgers weakly predicts that SPY will move in the direction of their bet. This predictive power is strongest (but still not strong) during the two weeks after report release and dissipates thereafter.
The aggregate behaviors of non-commercial and non-reportable traders weakly predict that SPY will move in the direction opposite to their bets. These predictive powers are strongest (but still not strong) during the four weeks after report release and dissipate thereafter.
Observations suggests that the behavior of non-commercial traders may be most information (in a contrarian sense).
For a closer look, we focus on non-commercial traders with a four-week return horizon.
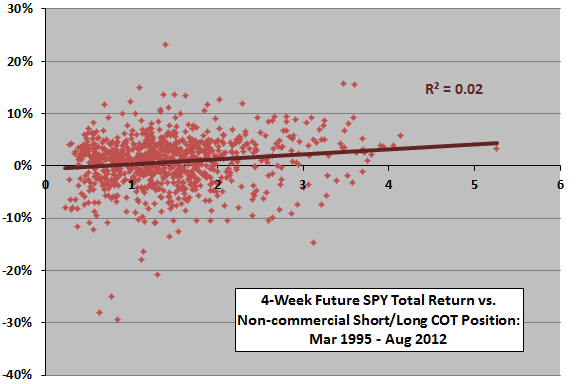
The following scatter plot relates SPY four-week future return to weekly COT report short-long ratio for non-commercial traders over the entire sample period. Four-week return measurement intervals overlap. The Pearson correlation for this relationship is 0.15 and the R-squared statistic 0.02, indicating that variation in the short-long ratio explains only 2% of the variation in future SPY return.
In case the relationship is materially non-linear, we asses future index returns by range of the short-long ratio.
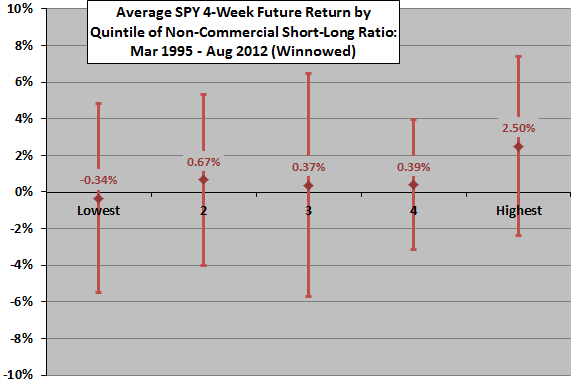
The next chart summarizes average four-week future SPY returns by ranked fifth (quintile) of COT report short-long ratio for non-commercial traders over the entire sample period, with one standard deviation variability ranges. To ensure independence of returns, the sample is winnowed such that four-week return measurement intervals do not overlap (residual 45 observations per quintile).
Results indicate that the above relationship is largely a distribution tail effect, driven by the extreme quintiles. Note that this analysis is in-sample. A trader operating in real time would not have been able to identify the quintile thresholds used.
Is this result stable over time?
The final chart summarizes average four-week future SPY returns by ranked quintile of COT report short-long ratio for non-commercial traders over the entire sample period (as in the preceding chart) and two equal subperiods. Results are quite different across subperiods, undermining belief in a reliably predictive relationship.
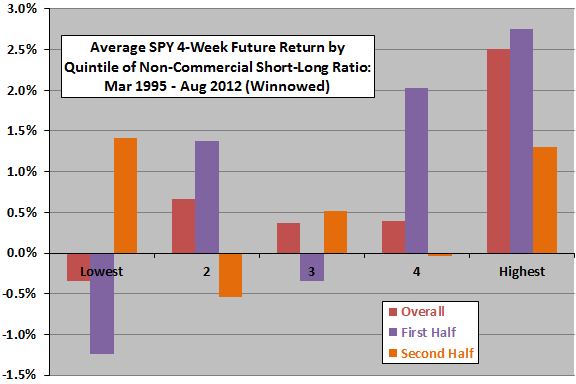
In summary, evidence does not support belief that aggregate S&P 500 Index futures positions reliably predict future stock market returns.
Cautions regarding findings include:
- As noted, the above tests are in-sample tests. A trader operating in real time during the sample period would have had less information to inform decisions.
- Use of data for different trader groups and selection of future return horizon introduce data snooping bias and overstatement of unbiased returns.
- Lack of SPY price for the week of 9/11/01 introduces a slight perturbation in return calculations.