Subscribers asked whether the monthly winner (Top 1) of the Simple Asset Class ETF Momentum Strategy (SACEMS) is more prone to mean reversion than momentum, thereby justifying its exclusion from or lower weight within SACEMS portfolios. SACEMS each month picks winners from the following universe of eight asset class exchange-traded funds (ETF), plus cash:
PowerShares DB Commodity Index Tracking (DBC)
iShares MSCI Emerging Markets Index (EEM)
iShares MSCI EAFE Index (EFA)
SPDR Gold Shares (GLD)
iShares Russell 2000 Index (IWM)
SPDR S&P 500 (SPY)
iShares Barclays 20+ Year Treasury Bond (TLT)
Vanguard REIT ETF (VNQ)
3-month Treasury bills (Cash)
To investigate, we review relevant past research and conduct in-depth robustness tests of SACEMS monthly returns and volatilities across all ranks 1 through 9 and ranking (lookback) intervals one to 12 months. Limited by availability of DBC (inception February 2006) and a 12-month lookback interval, we start the comparison with March 2007. Using monthly dividend adjusted closing prices for the asset class proxies and the yield for Cash during February 2006 through February 2019, we find that:
The following findings from past research are relevant:
- “SACEMS Applied to Mutual Funds” (with a materially longer sample period) does not confirm bad performance of Top 1.
- The “Average Monthly Gross Return by Rank” chart in “Adjust the SACEMS Lookback Interval?” disconcertingly shows a lot of noise in relative performances of top three ranks across 3-month, 4-month and 5-month lookback intervals. For the 3-month and 4-month lookbacks, rank 2 performs exceptionally well. For the 5-month lookback, rank 3 outperforms both ranks 1 and 2. The equally weighted (EW) Top 3 portfolio suppresses this noise via diversification.
- The cumulative performance chart at “Momentum Strategy (SACEMS)” shows that Top 1 does pretty well until mid-2015. In other words, its performance differs across subperiods. The cumulative chart in “SACEMS with Risk Parity?” confirms a decline in 2015 for different momentum implementations.
It is possible that Top 1 started experiencing reversion in 2015 (for example, due to expanding adoption of asset class momentum strategies).
As a deeper robustness test, the following table extends the average monthly gross return analysis across ranks and lookback intervals cited in point 2 above to encompass all ranks and lookback intervals one to 12 months over the available sample period. Calculations assume:
- Reallocate/rebalance at the close on the last trading day of each month (assume we can accurately rank ETFs based on past total returns just before the close).
- Ignore monthly portfolio rebalancing frictions.
- Ignore any tax implications of trading.
Below the table is a “heat map” key explaining shading within table cells. Cells with values close to the average for all cells have light gray shading. Cells with values breaching thresholds of X standard deviations (SD) above and below average have gradations of red/orange and blue shading, respectively. Notable points are:
- Results are generally very noisy, undermining firm conclusions.
- The hottest (coldest) part of the table falls within relatively high ranks and relatively short lookback intervals (within high ranks).
- There may well be Top 1 mean reversion for long lookback intervals.
- Ranks 2 and 3 are overall more attractive than Top 1.
Given noisiness of returns and plausibility that changing the lookback interval shifts performance among nearby ranks, the overall message may be more that diversification across ranks 1 through 3 is important than that Top 1 is unattractive.
As a further robustness test, we look at monthly return volatilities in the same way.
![]()
![]()
The next table presents monthly return volatilities by rank and by lookback interval over the available sample period. Below the table is a “heat map” key explaining shading within table cells. Cells with values close to the average for all cells have light gray shading. Cells with values breaching thresholds of X standard deviations (SD) below and above average have gradations of red/orange and blue/green shading, respectively (low volatilities are “hot” and high volatilities are “cold”). Notable points are:
- Again, results are generally very noisy, undermining firm conclusions, as does the fact that standard deviation includes both upside and downside volatility.
- The hottest (coldest) part of the table falls within ranks 2 and 3 high (rank 9).
- Rank 1 overall has a little above average volatility.
Overall, results support some preference for ranks 2 and 3.
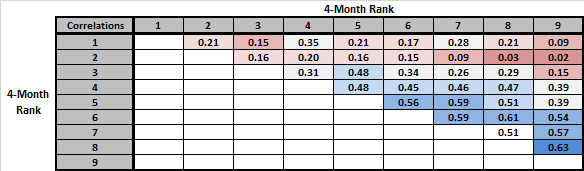
As an ancillary robustness test, we look at pairwise correlations of returns across ranks for the baseline 4-month lookback interval.
![]()
![]()
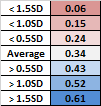
The final table presents pairwise Pearson correlations of average monthly gross returns across all SACEMS ranks based on a 4-month lookback interval over the available sample period. For example, row 1-column 2 is the correlation between rank 1 and rank 2 return series. Below the table is a “heat map” key explaining the shading within table cells. Cells with values close to the average for all cells have light gray shading. Cells with values breaching thresholds of X standard deviations (SD) below and above average have gradations of red and blue shading, respectively (low correlations are “hot” and high correlations are “cold”). Notable points are:
- Ranks 1 and 2 have low correlations with all other ranks. Specifically, rank 1-rank 2(0.21), rank 1-rank 3 (0.15) and rank 2-rank 3 (0.16) correlations are all low, confirming diversification benefits of the EW Top 3 portfolio.
- High correlations concentrate among low-ranked pairs.
Combined with the preceding table, overall messages are that winners win independently and losers lose together.
In summary, available evidence offers some, but not compelling, support for focusing on ranks 2 and 3 for constructing SACEMS portfolios. Support for diversification across top rankings is broader.
Cautions regarding findings include:
- The above analyses offer opportunities for extreme snooping of available data in choosing ranks included in a portfolio and lookback interval. Extreme snooping engenders extreme overstatement of expected performance.
- The available sample period is not long in terms of variety of market conditions. Inconsistency of Top 1 performance across subperiods amplifies this caution.
- Findings may differ for a different universe of assets.