Do momentum (nearest contract 12-month excess return), value (spot price change from one year ago to five years ago) and basis (12-month average ratio of nearest to next-nearest contract prices) commodity futures premiums hold up over the very long run? In their February 2019 paper entitled “Two Centuries of Commodity Futures Premia: Momentum, Value and Basis”, Christopher Geczy and Mikhail Samonov measure momentum, value and basis premiums with a 141-year sample of commodity futures contract prices, focusing on a previously untested old subsample. Specifically, they each month for each premium categorize each contract series as high, middle or low. They then measure gross performances of long-short (equally weighted high minus low) and long-only (equally weighted high) portfolios for each premium. They further assess diversification benefits by comparing a stocks-bonds portfolio with stocks-bonds-commodity futures portfolios. Using 25,595 nearest contract month returns (averaging 15.2 commodities per month for the full sample, but only 7.1 per month for the old untested subsample through 1959), U.S. stock and bond market returns and U.S. Treasury bill (T-bill) yield as the risk-free rate during 1877 through 2017, they find that:
- The equally weighted full universe of commodity futures generates average monthly gross excess (relative to T-bills) return 0.4%, 0.2% up through and 0.6% after 1959. Overall gross monthly Sharpe ratio is 0.07, with maximum drawdown -91%.
- All three gross premiums (average long-short portfolio monthly gross excess return) are significantly positive in the old untested subsample:
- The momentum premium is 1.1% overall, 0.9% through and 1.2% after 1959. Overall gross monthly Sharpe ratio is 0.18, with maximum drawdown -59%.
- The value premium is 0.9% overall, 1.0% through and 0.9% after 1959. Overall gross monthly Sharpe ratio is 0.15, with maximum drawdown -66%.
- The basis premium is 0.9% overall, 0.7% up through and 1.3% after 1959. Overall gross monthly Sharpe ratio is 0.16, with maximum drawdown -83%.
- Pairwise return correlations among the three premiums are low (-0.18 to 0.27) and fairly stable from old to recent subsamples.
- A combo long-short portfolio (equally weighting the three long-short premiums), generates average monthly gross excess return 1.0% over the full sample, 0.8% through and 1.1% after 1959. Overall gross monthly Sharpe ratio is 0.27, with maximum drawdown -41%. This portfolio beats the equally weighted full universe in 13 of 14 decades (see the chart below).
- A long-only combo portfolio generates overall average monthly gross excess return 0.9%, with gross monthly Sharpe ratio is 0.16 and maximum drawdown -87%.
- For retrospective (perfect foresight) mean-variance optimized portfolios including stocks and bonds over the full sample period:
- For stocks and bonds only, optimal allocations are 39% and 61%, respectively, generating 0.13 gross monthly Sharpe ratio.
- Including the long-only equally weighted full universe of commodity futures, optimal allocations are 32% stocks, 52% bonds and 16% commodity futures, generating 0.15 gross monthly Sharpe ratio.
- Including the long-only combo of commodity futures premiums, optimal allocations are 19% stocks, 51% bonds and 30% commodity futures, generating 0.20 gross monthly Sharpe ratio. This portfolio has average gross monthly return:
- -0.4% when stock returns are negative, compared to -1.2% for stocks and bonds only.
- -0.1% when bond returns are negative, compared to -0.5% for stocks and bonds only.
- 1.0% when inflation is high, compared to 0.6% for stocks and bonds only.
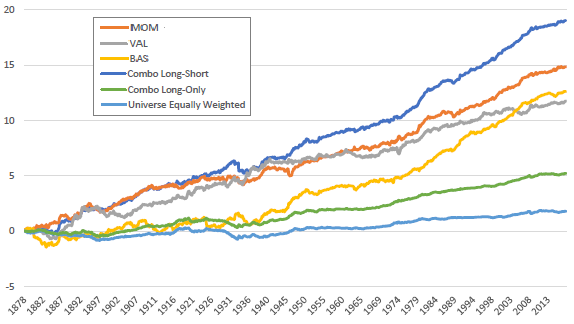
The following chart, taken from the paper, compares gross cumulative returns of momentum (MOM), value (VAL) and basis (BAS) commodity futures long-short premiums, as well as those of the combo long-short and combo long-only portfolios as specified above. For reference, it also includes gross cumulative return for the equally weighted full universe of commodity futures. Results show that:
- Individual premiums far outperform the equally weighted universe.
- The combo long-short effectively exploits premium diversification.
- The combo long-only captures only a modest part of long-short premiums.
- Relative performance of the three long-short premiums varies over time.

In summary, evidence from previously untested commodity futures data confirms existence of (gross) momentum, value and basis premiums, but two of three premiums are much lower for this data. Findings offer recalibration of expected premiums.
Cautions regarding findings include:
- Results are gross, not net. Accounting for trading frictions associated with monthly portfolio reformation and rebalancing to equal weights would reduce all returns. Per the authors: “Such costs could have been significant enough to eat away a large portion of the profits from these premia.”
- Costs and timeliness of data collection/processing for monthly trading may have been problematic in early decades. Also, commodity futures market capacities may have limited trading.
- As noted in the paper, mean-variance optimization of multi-class portfolios is in-sample. An investor operating in real time could not have known the resulting optimal allocations.