Subscribers have asked whether risk-adjusted returns might work better than raw returns for ranking Simple Asset Class ETF Momentum Strategy (SACEMS) assets. In fact, “Alternative Momentum Metrics for SACEMS?” supports belief that Sharpe ratio beats raw returns. Is this finding strong enough to justify changing the strategy, which each month selects the best performers over a specified lookback interval from among the following eight asset class exchange-traded funds (ETF), plus cash:
PowerShares DB Commodity Index Tracking (DBC)
iShares MSCI Emerging Markets Index (EEM)
iShares MSCI EAFE Index (EFA)
SPDR Gold Shares (GLD)
iShares Russell 2000 Index (IWM)
SPDR S&P 500 (SPY)
iShares Barclays 20+ Year Treasury Bond (TLT)
Vanguard REIT ETF (VNQ)
3-month Treasury bills (Cash)
To investigate, we update the basic comparison and conduct three robustness tests:
- Does Sharpe ratio beat raw returns consistently across Top 1, equally weighted (EW) Top 2, EW Top 3 and EW Top 4 portfolios, and the 50%-50% SACEMS EW Top 3-Simple Asset Class ETF Value Strategy (SACEVS) Best Value portfolio?
- Does Sharpe ratio beat raw returns consistently across different lookback intervals?
- For multi-asset portfolios, does weighting by Sharp ratio rank beat equal weighting? In other words, do future returns behave systematically across ranks?
To calculate Sharpe ratios, we each month for each asset subtract the risk-free rate (Cash yield) from raw monthly total returns to generate monthly total excess returns over a specified lookback interval. We then calculate Sharpe ratio as average monthly excess return divided by standard deviation of monthly excess returns over the lookback interval. We set Sharpe ratio for Cash at zero (though it is actually zero divided by zero). Using monthly dividend-adjusted closing prices for asset class proxies and the yield for Cash during February 2006 (when all ETFs are first available) through December 2018, we find that:
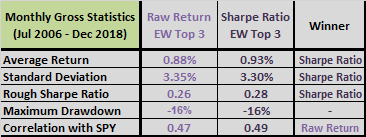
We first update the comparison between raw return-ranked and Sharpe ratio-ranked SACEMS EW Top 3 for the baseline 5-month lookback interval. The following table compares gross monthly performance over the available sample period, including maximum drawdowns (MaxDD) based on monthly measurements. Notable points are:
- Sharpe ratio beats raw return based on average monthly return, standard deviation of monthly returns and the ratio of the two (Rough Sharpe Ratio).
- Sharpe ratio does not improve MaxDD.
- Sharpe ratio monthly returns are slightly more correlated with SPY returns than raw return monthly returns.
For longer-term perspective, we look at annualized/annual performance.
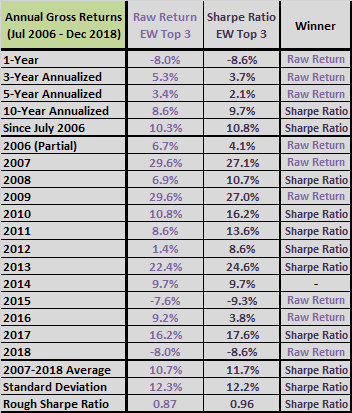
The next table compare gross annualized returns, or compound annual growth rates (CAGR), over several intervals and annual returns for the baseline 5-month lookback interval. Notable points are:
- Sharpe ratio beats raw return based on CAGR over the last 10 years and the full sample period, but not over any of the shorter annualized intervals.
- Sharpe ratio beats raw return for six of 12 full calendar years, and loses five years.
- Sharpe ratio wins based on average annual return, standard deviation of annual returns and the ratio of the two (Rough Sharpe Ratio).
For visual perspective, we plot cumulative returns.
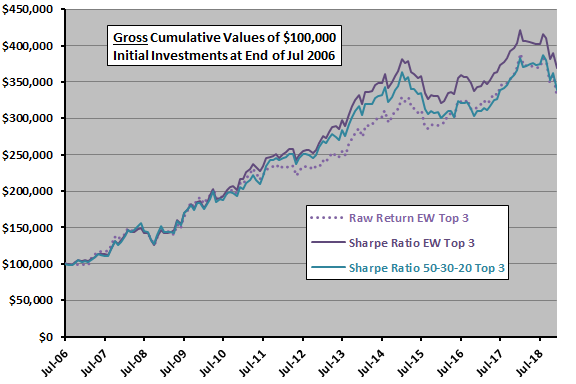
The following chart compares for the baseline 5-month lookback interval gross cumulative values of $100,000 initial investments in the two versions of SACEMS EW Top 3, and an alternative Top 3 that assigns 50%, 30% and 20% weights to the top three Sharpe ratio winners, respectively (50-30-20 Top 3). Sharpe ratio EW Top 3 is the winner, with separation from raw returns occurring mostly in 2010-2012 as indicated by the preceding table.
For understanding of differences, we first compare allocations and then look at performance of individual assets by rank.
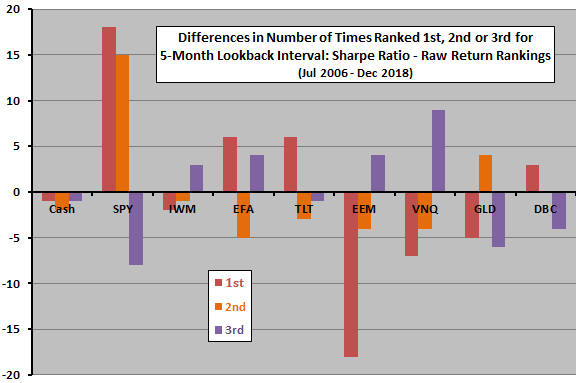
The next chart summarizes differences in Top 3 allocations for the baseline 5-month lookback interval over the available sample period. The principal effect of switching from raw return to Sharpe ratio is a shift from EEM (emerging equity markets) to SPY (U.S. large capitalization stocks).
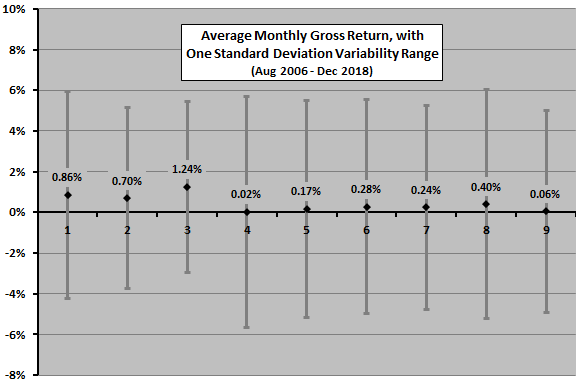
The next chart summarizes average return by Sharpe ratio ranks, with one standard deviation variability ranges, for the baseline 5-month lookback interval. Notable findings are:
- The top three ranks have the strongest average returns.
- Average returns do not vary systematically across ranks, with rank 3 very high and rank 4 very low. This finding undermines confidence in the precision of Sharpe ratio ranking. It also shows why EW Top 3 outperforms 50-30-20 Top 3.
Next we look at different portfolios.
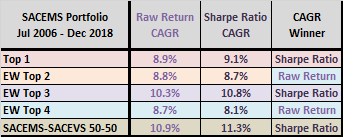
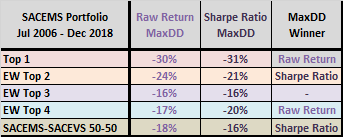
The next two tables compares CAGRs and MaxDDs for SACEMS Top 1, EW Top 2, EW Top 3 and EW Top 4 portfolios and for 50%-50% SACEMS EW Top 3-SACEVS Best Value (SACEVS-SACEMS 50-50) for the baseline 5-month lookback interval over the available sample period. Contest results are mixed and generally close.
Finally, we look at alternative lookback intervals.
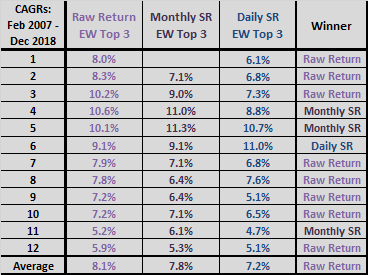
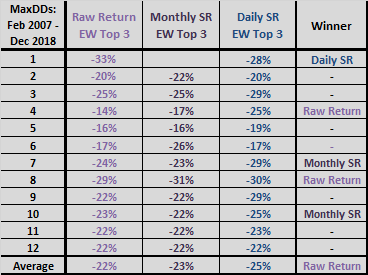
The next two tables compare CAGRs and MaxDDs for raw returns-ranked and Sharpe ratio-ranked SACEMS EW Top 3 across lookback intervals ranging from two to 12 months (Sharpe ratio is undefined for one month). First monthly returns are for March 2007 to accommodate the longest lookback interval of 12 months. This robustness test is important to the extent that there is no truly optimal lookback interval out-of-sample. Notable points are:
- For CAGRs, Sharpe ratio beats raw return for three of 11 lookback intervals, loses seven intervals and loses on average. However, Sharpe ratio wins for the baseline 5-month interval and for the 4-month lookback interval.
- For MaxDDs, Sharpe ratio beats raw return for only two of 11 lookback intervals, loses four intervals and loses on average. However, MaxDD differences are generally small.
The finding for CAGRs indicates that performance based on raw return rankings is materially more robust to choice of lookback interval. In other words, if making an error in selecting the best lookback interval (or if using a combination of lookback intervals), raw return is likely better than Sharpe ratio.
Does it matter if we calculate Sharpe ratio with daily, rather than monthly, data over these lookback intervals?
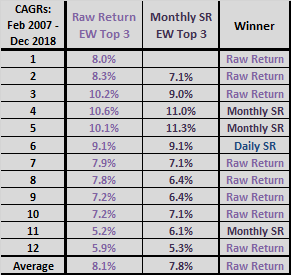
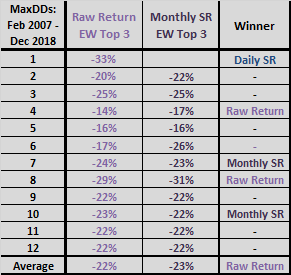
The final pair of tables adds one column to each of the last two charts showing CAGRs (upper chart) and MaxDDs for using Sharpe ratios calculated across lookback intervals with daily rather than monthly T-bill yield and asset returns, with months approximated as 21 trading days. For example, daily Sharpe ratio for a 4-month lookback interval is average daily return over the past 84 trading days divided by standard deviation of daily returns over this same interval. This approach allows calculation of Sharpe ratios for a 1-month lookback interval. Results indicate that daily Sharpe ratios (Daily SR) mostly generate lower CAGRs and slightly deeper MaxDDs than monthly Sharpe ratios (SR).
In summary, evidence from multiple tests on available data suggests that Sharpe ratio-ranked SACEMS is not superior enough to raw return-ranked SACEMS to justify changing the baseline strategy. In fact, the final test suggests that the former is less robust to uncertainty in the optimal lookback interval than the latter.
Cautions regarding findings include:
- Sample size is modest (about 30 independent 5-month and 13 independent 12-month lookback intervals).
- As noted, analyses are gross. Accounting for costs of monthly portfolio reformation would reduce returns. However, turnovers are similar for the two competing models.
- As noted, future performance of assets does not vary systematically by past Sharpe ratio rank, undermining belief in the precision of past performance as a predictor of future performance.
- Testing multiple lookback intervals and different ranking metrics introduces introduces data snooping bias, such that the best-performing combinations overstate expectations.