What is the best way to construct equity multifactor portfolios? In the November 2018 revision of their paper entitled “Equity Multi-Factor Approaches: Sum of Factors vs. Multi-Factor Ranking”, Farouk Jivraj, David Haefliger, Zein Khan and Benedict Redmond compare two approaches for forming long-only equity multifactor portfolios. They first specify ranking rules for four equity factors: value, momentum, low volatility and quality. They then, each month:
- Sum of factor portfolios (SoF): For each factor, rank all stocks and form a factor portfolio of the equally weighted top 50 stocks (adjusted to prevent more than 20% exposure to any sector). Then form a multifactor portfolio by equally weighting the four factor portfolios.
- Multifactor ranking (MFR): Rank all stocks by each factor, average the ranks for each stock and form an equally weighted portfolio of those stocks with the highest average ranks, equal in number of stocks to the SoF portfolio (again adjusted to prevent more than 20% exposure to any sector).
They consider variations in number of stocks selected for individual factor portfolios from 25 to 200, with comparable adjustments to the MFR portfolio. They assume trading frictions of 0.05% of turnover. Using monthly data required to rank the specified factors for a broad sample of U.S. common stocks and monthly returns for those stocks and the S&P 500 Total Return Index (S&P 500 TR) during January 2003 through July 2016, they find that:
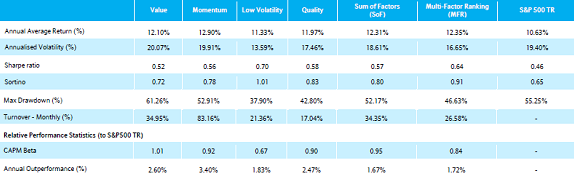
- Regarding individual factor portfolios (see the table below):
- All outperform S&P 500 TR based on annualized average return.
- Value and momentum outperform most, but with highest overall risks, highest tail risks, deepest drawdowns and largest turnovers.
- Low volatility outperforms least, but performs best after adjusting for market beta and has the highest Sharpe ratio and Sortino ratio. It tends to perform best (worst) when the market is weak (strong).
- Quality factor performance has similarities to that of low volatility.
- Comparing MFR and SoF multifactor portfolios:
- Baseline Sharpe ratios are 0.64 versus 0.57. Average return is similar, with MFR’s advantage deriving from its lower volatility.
- Both typically have market betas less than one, indicating that they tend to perform best (worst) when the market is weak (strong).
- MFR wins regardless of the number of stocks in the portfolio, with outperformance increasing as the number of stocks increases.
- MFR has a large loading on the low volatility factor, while SoF loads more evenly across the four factors. MFR is therefore exposed to poor low volatility factor performance.
The following table, constructed from two tables in the paper, summarizes key net performance statistics for individual factor portfolios based on top 50 rankings, corresponding SoF and MFR portfolios and S&P 500 TR over the full sample period. Assumed trading frictions for factor/multifactor portfolios are 0.05% of traded value.
In summary, evidence indicates that an integrated multifactor ranking approach beats a portfolio of factor portfolios approach in recent data, due largely to the low volatility tilt of the former.
Cautions regarding findings include:
- The sample period is modest for analysis of annual portfolio performance.
- Many investors may not be able to achieve the assumed level of trading frictions.
- Methods/execution are beyond the reach of most investors, who would bear fees for delegating to a fund manager.
See also: