What is the best way to suppress trading frictions for active, long-term stock portfolios? In their September 2018 paper entitled “Comparing Cost-Mitigation Techniques”, Robert Novy-Marx and Mihail Velikov compare three approaches to suppression of trading frictions for long-term stock factor premium capture strategies:
- Limiting selection to stocks that are cheap to trade.
- Rebalancing infrequently.
- Imposing a penalty for opening a new position compared to maintaining an established position (banding).
They also evaluate indirect suppression of trading frictions from exploiting a secondary premium (stock sort) that sometimes delays or even cancels trades targeting the primary premium. They consider three stock universes: large (top 90% of total market capitalization); small (the next 9%); and, micro (the next 0.9%). They estimate trading frictions as effective bid-ask spreads. Their test portfolios are long-short extreme fifths (quintiles) of stocks sorted on seven stock/firm variables as specified in widely cited academic literature: accounting (failure probability and net stock issuance); defensive (beta and idiosyncratic volatility); and, momentum (conventional, unexpected earnings and earnings announcement). Using specified data during January 1975 through December 2016, they find that:
- All seven test portfolios generate positive average annual gross returns.
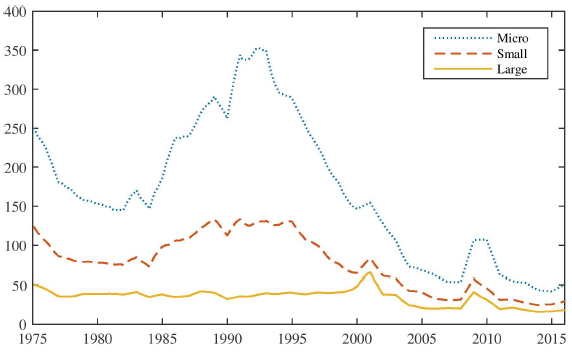
- Average one-way trading frictions across the seven test portfolios for large, small, and micro stocks are (see the chart below):
- Over the full sample period, 0.27%, 0.62% and 1.51%, respectively.
- Near the end of the sample period, 0.19%, 0.31%, and 0.57%, respectively, with decimalization, algorithmic trading and direct market access likely driving the dramatic reduction.
- Turnover varies considerably across the seven test portfolios, resulting in large differences in annual trading frictions.
- Net average returns are materially lower than gross for all test portfolios and all stock sizes.
- For large stocks, none of the seven test portfolios produce statistically significant net average returns, and those for defensive portfolios are negative.
- For small and micro stocks, half the portfolios have statistically significant and positive net average returns, but net returns are on average 55% (77%) lower than gross for small (micro) stocks.
- Regarding the above three common approaches to suppression of trading frictions:
- Limiting stock picks to the most liquid stocks within a universe dramatically reduces test portfolio average gross returns, because the best-performing stocks tend to concentrate among those most costly to trade. In fact, this approach often hurts net performance.
- Less frequent rebalancing (such as quarterly vice monthly) also typically reduces test portfolio performance, but less severely than for limiting picks to the most liquid stocks, and so offers some net performance improvement.
- Banding offers turnover reductions similar to those for reducing the rebalancing frequency, but generates higher net returns by applying signal quality to each trading decision.
- While suppression of trading frictions often helps, net Sharpe ratios from test portfolios remain only market-like, helping to explain how large gross factor premiums persist.
- Adding a complementary secondary stock sort to a primary sort (for example, adding a momentum sort to a size sort) may inhibit trading of the primary sort with no performance penalty.
- Equal weighting incurs 9.50% average annual trading frictions across the seven test portfolios, compared to 1.83% for value weighting, thereby often offering lower net performance.
The following chart, taken from the paper, tracks average estimated one-way stock trading frictions (effect bid-ask spreads) for each of the large, small and micro stock universes in basis points over time. Large corresponds roughly to the Russell 1000. Small corresponds roughly to the Russell 2000. Over the last five years of the sample period, frictions average 0.18%, 0.27% and 0.48% for large, small and micro, respectively. Prior to the early 2000s, estimated frictions are much higher.
This chart suggests that, for long-run backtests:
- Average gross return is not very informative.
- Accounting for trading frictions that vary with stock size and over time is very complicated.

In summary, evidence indicates that exploitation of widely cited stock factor premiums is problematic due to trading frictions involved in implementation. Approaches to suppressing these frictions are of some to no value.
Cautions regarding findings include:
- Effective bid-ask spread does not account for broker fees, which may be material over the sample period for many investors.
- Effective bid-ask spread does not account for price impact of large trades (strategy capacity), which may be material over the sample period for some investors.
See also “Trading Frictions Over the Long Run”.