Why do simple stock portfolios such as equal weighting and random weighting beat market capitalization weighting over the long run? In their June 2018 paper entitled “Diversification, Volatility, and Surprising Alpha”, Adrian Banner, Robert Fernholz, Vassilios Papathanakos, Johannes Ruf and David Schofield tackle this question by decomposing expected stock portfolio log-return into average growth rate and excess growth rate (EGR). They focus on average log-return because, unlike arithmetic and geometric averages, it is an unbiased estimator of long-term performance. They apply two formulas derived in prior work to estimate portfolio log-returns:
- Expected portfolio log-return = weighted average stock log-return + EGR
- EGR = (weighted average stock return variance – portfolio return variance)/2
They apply these formulas to the following five portfolios, each consisting of monthly overlapping sub-portfolios formed from the 1,000 U.S. stocks with the (each day) largest market capitalizations and rebalanced annually with stock weights normalized to a sum of one:
- Capitalization-weighted (CW) – stock weights are proportional to their respective market capitalizations.
- Equal-weighted (EW) – weight of each stock is 1/1000.
- Large-overweighted (LO) – stock weights are proportional to the square of their respective market capitalizations.
- Random-weighted (RW) – stock weights are proportional to random values between zero and one (median of 1,000 trials).
- Inverse random-weighted (IRW) – stock weights are proportional to the reciprocals of random values between zero and one (median of 1,000 trials).
EGR quantifies the extent to which portfolio volatility is less than constituent stock volatilities and is always positive for long-only portfolios. Higher constituent stock volatilities generate higher portfolio EGRs. Using daily prices for the 1,000 U.S. stocks with the largest market capitalizations each day during 1964 through 2012 (5,384 distinct stocks over 49 years), they find that:
- Over the sample period, average log-returns do not vary with market capitalization rank. In other words, smaller stocks do not have higher expected log-returns than larger stocks.
- Log-return variance, however, varies systematically with market capitalization rank, with smaller stocks having higher variances than larger stocks (see the chart below).
- Variation among log-returns of different portfolios therefore depends essentially on differences in their respective EGRs, as driven by different mixes of smaller and larger stocks. Since smaller stocks tend to be more volatile than larger stocks, portfolios tilted toward smaller stocks tend to have higher EGRs and therefore higher overall expected log-returns.
- Specifically, over the 49-year sample period (see the table below):
- The EW, RW and IRW portfolios specified above all outperform the CW portfolio, due largely to differences in EGRs.
- The CW portfolio outperforms the LO portfolio for the same reason.
The following chart, taken from the paper, plots annualized daily log-return variance by market capitalization rank for the top 1000 U.S. stocks over the full sample period. The green line is a smoothed version of results. The chart shows that smaller stocks tend to have a larger variance than larger stocks.
In contrast average daily log-return by market capitalization rank is approximately flat, indicating that smaller and larger stocks have about the same expected log-return.
![]()
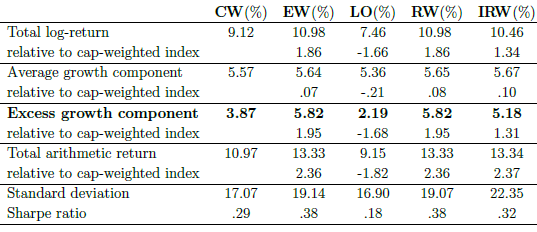
The following table, also from the paper, summarizes annualized gross performance statistics for the five portfolios specified above. Notable points are:
- Average log-returns (average growth components) are similar, with EW, RW and IRW having only slight advantages over CW.
- EGRs (excess growth components), however, differ considerably. EW and RW (IRW) outperform CW by about 2% (1.5%) annually. Return outperformance translates to higher Sharpe ratios.
- Performances of EW and RW are nearly identical, since many random weighting trials tend to average to equal weights.
In summary, evidence indicates that simple stock portfolios such as equal weighting and random weighting beat market capitalization weighting over the long run due to higher volatilities, not higher returns, of smaller stocks.
Cautions regarding findings include:
- All findings are gross, not net. Trading frictions tend to rise with asset volatility, and portfolio rebalancing thus tends to be more costly for smaller stocks than larger stocks. This tendency works against the EGR effect described above and may neutralize it.
- Findings may differ for other asset class universes.