A subscriber asked whether applying a filter that restricts monthly asset selections of the “Simple Asset Class ETF Momentum Strategy” (SACEMS) to those currently at an intermediate-term high improves performance. This strategy each month reforms a portfolio of winners from the following universe based on total return over a specified lookback interval:
PowerShares DB Commodity Index Tracking (DBC)
iShares MSCI Emerging Markets Index (EEM)
iShares MSCI EAFE Index (EFA)
SPDR Gold Shares (GLD)
iShares Russell 2000 Index (IWM)
SPDR S&P 500 (SPY)
iShares Barclays 20+ Year Treasury Bond (TLT)
Vanguard REIT ETF (VNQ)
3-month Treasury bills (Cash)
To investigate, we focus on the equally weighted (EW) Top 3 SACEMS portfolio and replace any selection not at an intermediate-term high with Cash. We define intermediate-term high based on monthly closes over a specified past interval ranging from one month to six months. We consider all gross performance metrics used for base SACEMS. Using monthly dividend adjusted closing prices for the asset class proxies and the yield for Cash over the period February 2006 (the earliest all ETFs are available) through July 2018 (150 months), we find that:
As for base SACEMS, we each month rank all assets in the universe based on total return over a 5-month lookback interval. The 6-month high filter therefore uses the same data as the base SACEMS past return interval. We then replace any Top 3 selections not at an intermediate-term high with Cash.
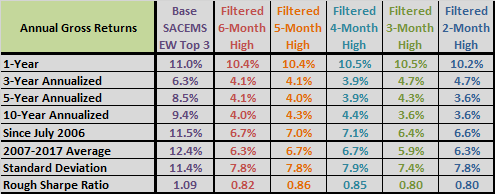
The following tables compare monthly performance statistics plus maximum drawdowns (upper table) and annual performance statistics (lower table) for each of five filtered high variations over the available sample period. “Average Number of Assets” in the first table is the average number of the nine assets in the universe that pass the intermediate-term high filter.
Because Cash underperforms assets replaced by the high filter, filtered variations underperform base SACEMS return metrics, but the have lower volatilities. The compound annual growth rates (CAGR) and Sharpe ratios indicate that the lower volatilities fail to compensate for the reduced returns.
The sample period is short for comparison of annual returns.
How do such differences translate to performance of the EW Top 3 portfolio?


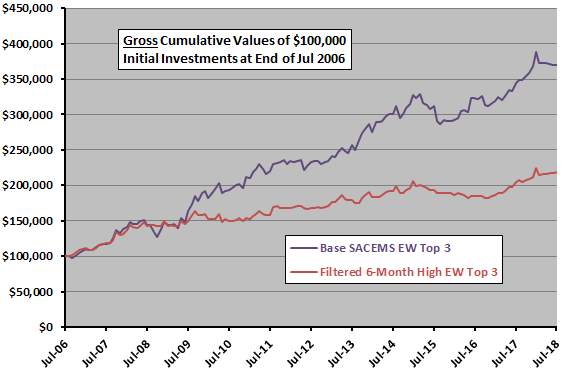
The following chart compares gross cumulative values of $100,000 initial investments in base SACEMS and in the filtered 6-month high variation over the available sample period. Results confirm the outperformance of base SACEMS and indicate that outperformance is present over most of the sample period.
For additional perspective, we dig deeper for the 6-month high filter.

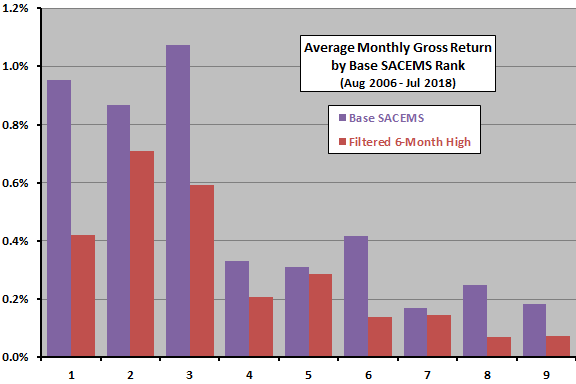
The final chart compares average gross monthly returns across all nine SACEMS ranks without and with the 6-month high filter. Filtered versions are all lower than base, and the top three assets remain dominant, arguing against bumping lower-ranked assets that pass the filter to replace higher-ranked assets that do not.

In summary, evidence from available data does not support belief that adding a recent high filter to SACEMS asset selections improves strategy performance.
Cautions regarding findings include:
- As noted, the sample period is not long in terms of number of years and variety of market conditions.
- As noted, performance statistics are gross, not net. Accounting for monthly portfolio reformation frictions would reduce returns. Differences in trading frictions among tested strategy variations are probably not decisive.
- Testing multiple recent high measurement intervals on the same data introduces snooping bias, such that best-performing result overstates expectations.