A subscriber asked whether some different momentum metric might improve performance of the “Simple Asset Class ETF Momentum Strategy” (SACEMS), which each month reforms a portfolio of winners from the following universe based on total return over a specified lookback interval:
PowerShares DB Commodity Index Tracking (DBC)
iShares MSCI Emerging Markets Index (EEM)
iShares MSCI EAFE Index (EFA)
SPDR Gold Shares (GLD)
iShares Russell 2000 Index (IWM)
SPDR S&P 500 (SPY)
iShares Barclays 20+ Year Treasury Bond (TLT)
Vanguard REIT ETF (VNQ)
3-month Treasury bills (Cash)
To investigate, we compare performances of the following alternative monthly momentum metrics to that of the original baseline metric:
- Average monthly total returns over the lookback interval.
- Slope of the dividend-adjusted price series over the lookback interval.
- Sharpe ratio of the monthly total return series over the lookback interval (using Cash return as the risk-free rate, and setting the Sharpe ratio of Cash at zero).
We focus on the equally weighted (EW) Top 3 SACEMS portfolio. We consider all the performance metrics used for the baseline, with emphasis on compound annual growth rates (CAGR) and maximum drawdowns (MaxDD). Using monthly dividend adjusted closing prices for the asset class proxies and the yield for Cash over the period February 2006 (the earliest all ETFs are available) through May 2018 (148 months), we find that:
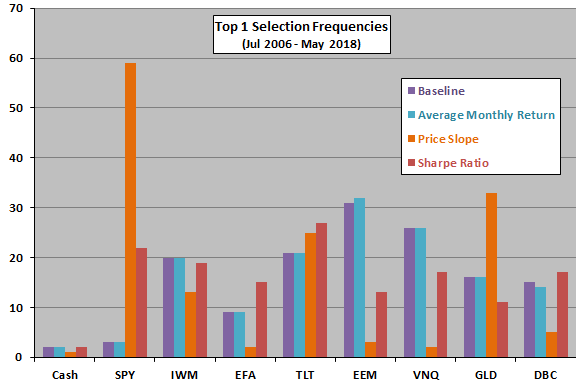
As in the baseline version of SACEMS, we each month rank all assets in the universe for each momentum metric based on a 5-month lookback interval. The following chart illustrates how distributions of winners (Top 1) differ across the baseline and alternative momentum metrics over the available sample period (143 winners each). The selections of the baseline metric and average monthly return are nearly identical. Those for price slope and Sharpe ratio are very different.
How do such differences translate to performance of the EW Top 3 portfolio?
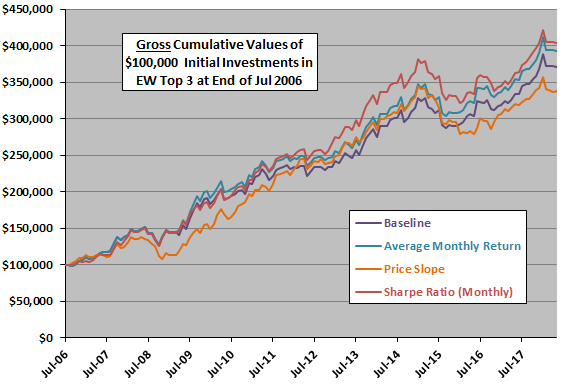
The next chart compares gross cumulative values of $100,000 initial investments in each of the momentum measurement metrics over the available sample period. The trajectories are tightly bunched, with price slope mostly the worst and Sharpe ratio mostly the best. Price slope appears to suffer deeper drawdowns. Outperformance of Sharpe ratio appears to concentrate during 2012-2013.
For perspective, we look at detailed performance statistics.
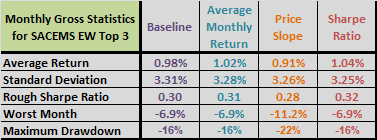
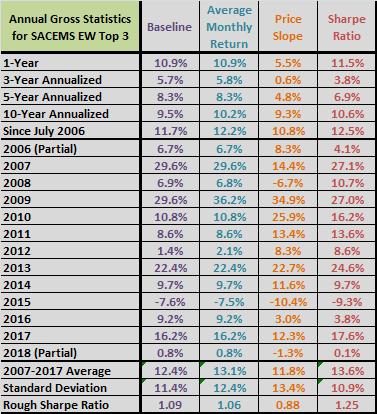
The following tables compare monthly performances statistics plus MaxDD (upper table) and annual performance statistics (lower table) for each of the momentum measurement metrics over the available sample period. Performance differences are generally small. Sharpe ratio has the highest rough annual Sharpe ratio (average annual return divided by standard deviation of annual returns during 2007 through 2017. However, the baseline metric and average annual return have higher CAGRs over the past three and five years. Price slope is generally weakest across statistics.
The sample period is short for comparison of annual returns.
In summary, evidence from available data provide some support for belief that a momentum metric other than the simple lookback-interval return may modestly boost performance of SACEMS EW Top 3.
Cautions regarding findings include:
- As noted, the sample period is not long in terms of number of years and variety of market conditions.
- As noted, performance statistics are gross, not net. Accounting for monthly portfolio reformation frictions would reduce returns (but there would be little difference in frictions among momentum metrics).
- Testing multiple momentum metrics on the same data introduces snooping bias, such that best-performing metric overstates expectations.