Do small market capitalization stocks really outperform big ones, as strongly implied by the prominence of the size effect in published research and factor models? In their May 2018 paper entitled “Fact, Fiction, and the Size Effect”, Ron Alquist, Ronen Israel and Tobias Moskowitz survey the body of research on the size effect and employ simple tests to assess claims made about it. Based on published and peer-reviewed academic papers and on tests using data for U.S. stocks and equity factor premiums, international developed and emerging market stocks and stock indexes, U.S. bonds and various currencies as available through December 2017, they find that:
- The U.S. size effect is weak and inconsistent over time.
- During the 1936-1975 size effect discovery sample period, the conventional U.S. SMB factor portfolio (short stocks in the top half of market capitalizations and long stocks in the bottom half, based on the NYSE breakpoint) generates a statistically insignificant 1.9% annualized average gross return with 10% annual volatility, translating to annualized gross Sharpe ratio 0.19 and 1-factor (market) alpha zero.
- A more focused portfolio that is long (short) the tenth, or decile, of stocks with the smallest (largest) market capitalizations over the same period generates annualized average gross return 7.1% with 25.3% annualized volatility, translating to gross annualized Sharpe ratio 0.28 and statistically significant 1-factor alpha 2.5%.
- Over an extended 1926-2017 sample period, the SMB factor (extreme decile) portfolio has annualized average gross return 2.5% (6.1%), both with statistically insignificant 1-factor alphas.
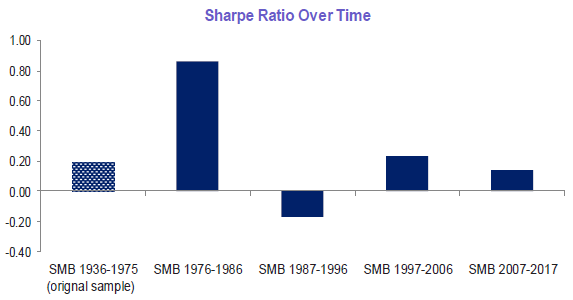
- SMA factor returns are erratic across subperiods (see the chart below).
- U.S. SMB factor portfolio gross performance is substantially weaker than those of such other conventionally used factors as: BAB (long-short low-high beta stocks); HML (long-short high-low book-to-market stocks); UMD (long-short stocks with high-low momentum); and, RMW (long-short stocks with robust-weak profitability).
- The U.S. size effect is weak or even negative during 1951-2017 when using size metrics not based on stock price such as book value of assets, book value of equity, sales, property-plant-equipment and number of employees.
- The weak U.S. size effect comes entirely during January, and this January effect diminishes over time. Over the extended 1926-2017 sample period, the SMB portfolio generates annualized average gross return 2.1% (0.0%) during January (other months). After 1975, the January effect averages only 1.0%.
- SMB portfolios for 24 non-U.S. developed equity markets offer no evidence of a size effect by country or by equally weighted region during 1984-2017. And, there is no significant size effect for emerging equity market stocks during 1994-2017.
- There is no size effect among developed equity market indexes since the beginning of 1975 or emerging market country indexes since the beginning of 1988, with size based on country aggregate stock market capitalization.
- There is no size effect among U.S. corporate bonds during 1997-2017, with size based on equity market capitalization.
- There is no size effect among currencies, with size based on country GDP.
- To the extent any U.S. size effect exists, it concentrates among the tiniest 5% of firms (average market capitalization $4.5 million). Trading frictions on the order of 1% largely offset any such effect. Moreover, U.S. SMB portfolio alphas are insignificant and half are negative after adjusting for different measures of liquidity. This barrier to exploitation carries over to use of double-sorts with size to amplify performances of other factors.
- Large firms tend to be of higher quality than small firms, such that the quality effect counters the size effect.
The following chart, taken from the paper, compares U.S. SMB portfolio gross annualized Sharpe ratios during the size effect 1936-1975 discovery (original) sample period to those of subsequent decade-by-decade subperiods through 2017. Performance is exceptionally strong during the first post-discovery decade (1976-1986), during which many follow-on size effect papers appear and practitioners commence attempts to exploit the effect (arguably creating unusually strong demand for small stocks). Since that decade, gross performance reverses to negative during 1987-1996 before returning to insignificantly positive over the final two decades.
In other words, there is usually no exploitable size effect (based on SMB for U.S. stocks).

In summary, evidence indicates that, in isolation, a size factor is not a useful source of expected net returns (not a key factor for constructing portfolios), despite its prominence in equity factor research and its attention from investors.
Cautions regarding findings include:
- Examination of performance data for size-based funds would test practical value/exploitability of the size effect. See, for example, “Measuring the Size Effect with Capitalization-based ETFs”.
- Widespread rejection of the size effect may stimulate investor reactions that produce underpriced small stocks.