A subscriber requested review of an analysis concluding that combining economic trend and market trend signals enhances market timing performance. Specifically, per the example in the referenced analysis, we look at combining:
- The 10-month simple moving average (SMA10) for the broad U.S. stock market. The trend is positive (negative) when the market is above (below) its SMA10.
- The 12-month simple moving average (SMA12) for the U.S. unemployment rate (UR). The trend is positive (negative) when UR is below (above) its SMA12.
We consider scenarios when the stock market trend is positive, the UR trend is positive, either trend is positive or both trends are positive. We consider two samples: (1) dividend-adjusted SPDR S&P 500 (SPY) since inception at the end of January 1993 (nearly 26 years); and, (2) the S&P 500 Index (SP500) since January 1948 (limited by UR availability), adjusted monthly by estimated dividends from the Shiller dataset, for longer-term robustness tests (nearly 71 years). Per the referenced analysis, we use the seasonally adjusted civilian UR, which comes ultimately from the Bureau of Labor Statistics (BLS). BLS generally releases UR monthly within a few days after the end of the measured month. We make the simplifying assumptions that UR for a given month is available for SMA12 calculation and signal execution at the market close for that same month. When not in the stock market, we assume return on cash from the broker is the yield on 3-month U.S. Treasury bills (T-bill). We focus on gross compound annual growth rate (CAGR), maximum drawdown (MaxDD) and annual Sharpe ratio as key performance metrics. We use the average monthly T-bill yield during a year as the risk-free rate for that year in Sharpe ratio calculations. While we do not apply any stocks-cash switching frictions or tax considerations, we do calculate the number of switches for each scenario. Using specified monthly data through September 2019, we find that:
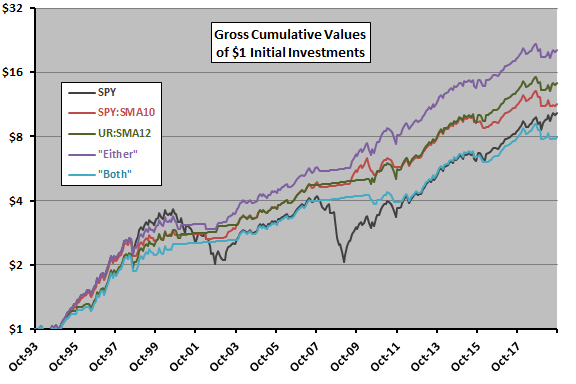
The following chart compares on a logarithmic scale gross cumulative values of $1 initial investments over the full sample period in each of:
- SPY – buy and hold SPY
- SPY:SMA10 – hold SPY (T-bills) when SPY at the end of the previous month is above (below) its SMA10.
- UR:SMA12 – hold SPY (T-bills) when UR at the end of the previous month is below (above) its SMA12.
- “Either” – hold SPY (T-bills) when either of scenarios 2 and 3 holds SPY (otherwise). In other words, at least one of the signals is favorable.
- “Both” – hold SPY (T-bills) when scenarios 2 and 3 agree on holding SPY (otherwise). In other words, both signals are favorable.
Notable findings are:
- SPY:SMA10 and UR:SMA12 perform similarly, but diverge recently.
- “Either” appears to increase safely the stock market participation of SPY:SMA10 or UR:SMA12. “Either” signals only two switches since May 2009.
- “Both” avoids drawdowns but does not boost long-term performance of SPY.
The following table quantifies gross CAGRs, MaxDDs, annual Sharpe ratios and number of SPY-cash switches for the above five scenarios. Results confirm that “Either” is as good as or better than other SPY timing signals for all metrics.
Using longer-term U.S. Treasuries (proxied by Vanguard Intermediate-Term Treasury Investor Shares, VFITX) as the “safe” asset boosts CAGRs of the timing scenarios by 1.5% to 2.1% (increasing “Either” to 13.2%).
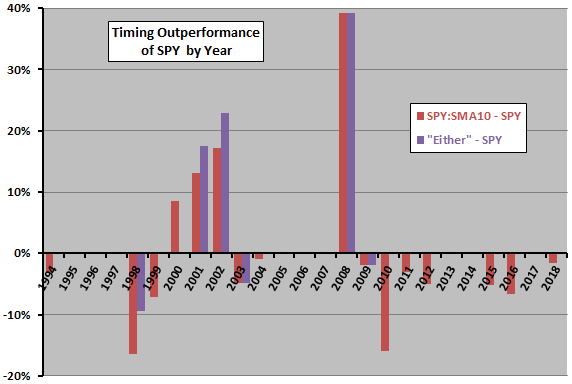
For additional insight, we look at SPY:SMA10 performance relative to SPY and “Either” performance relative to SPY during by year.

The next chart compares impacts of SPY:SMA10 and “Either” timing scenarios on annual SPY returns over the available sample period. Results suggest that Either is more precise than SPY:SMA10 for side-stepping U.S. equity bear markets. However, there are only two bear markets in the sample period, limiting confidence in this finding.
To check longer-term robustness of above findings, we look at the same scenarios applied to SP500.
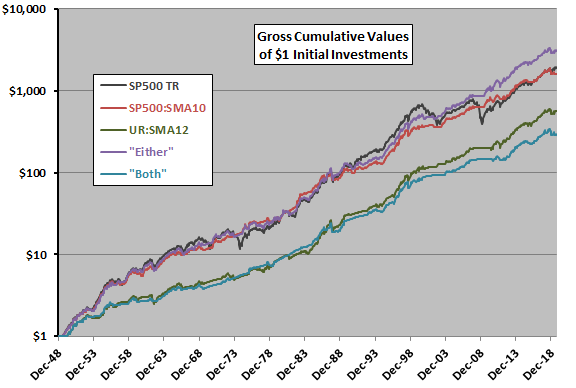
SP500 SMA10 calculations exclude estimated dividend adjustments, but return calculations do not. The following chart compares on a logarithmic scale gross cumulative values of $1 initial investments over the full sample period in each of five scenarios:
- SP500 – buy and hold SP500.
- SP500:SMA10 – hold SP500 (T-bills) when SP500 at the end of the previous month is above (below) its SMA10.
- UR:SMA12 – hold SP500 (T-bills) when UR at the end of the previous month is below (above) its SMA12.
- “Either” – hold SP500 (T-bills) when either of scenarios 2 and 3 holds SP500 (otherwise). In other words, at least one of the signals if favorable.
- “Both” – hold SP500 (T-bills) when scenarios 2 and 3 agree on holding SP500 (otherwise). In other words, both signals are favorable.
Notable findings are:
- SP500, SP500:SMA10 and “Either” perform similarly until the early 2000s, when “Either” begins to outperform. Again, “Either” has only two switches since May 2009.
- UR:SMA12 and “Both” clearly lag, with the former starting to outperform the latter around 2000.
In other words, a market timer would probably not have identified “Either” as an outperforming strategy until well into the 2000s.
The following table quantifies gross CAGRs, MaxDDs, annual Sharpe ratios and number of SP500-cash switches for the above five scenarios. Results confirm that “Either” is better than other SPY timing signals for most metrics. Buy-and-hold as modeled is stronger than in the shorter tests above.
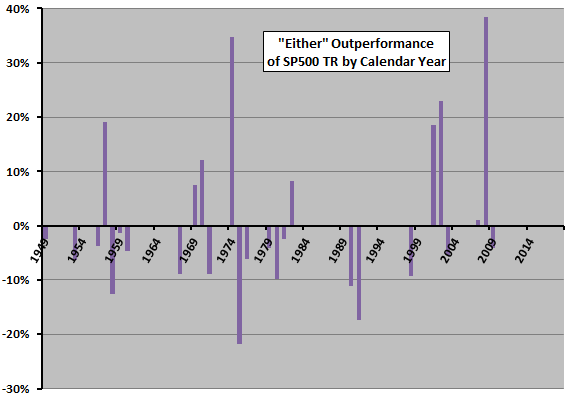
For additional insight, we look at “Either” performance relative to SP500 by calendar year.

The next chart tracks annual gross return of “Either” relative to SP500 over the available sample period. “Either” outperforms (underperforms) during 9 (18) of 70 years. It appears that limiting a backtest to the segment since the late 1990s may not be representative.
For additional perspective we look at returns by decade for all five scenarios.
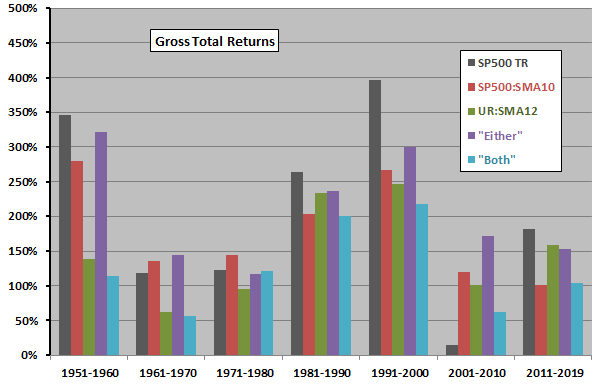
The next chart compares gross total returns for the five scenarios by decade over the available sample period, with the most recent decade partial. Notable points are:
- “Either” beats both SP500:SMA10 and UR:SMA12 during six of seven decades.
- UR:SMA12 beats SP500:SMA10 during two of seven decades.
- “Either” beats SP500 during two of seven decades (substantially only during 2001-2010).
In other words, based on CAGR, Either would likely not beat buy-and-hold for U.S. equity funds within a sample not including 2001-2010.
Are results sensitive to lookback interval?
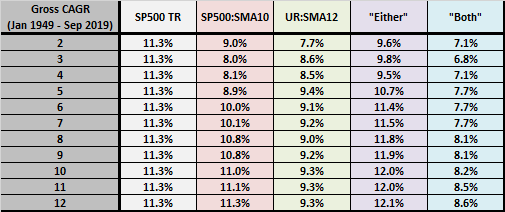
The final chart compares gross CAGRs over the full sample period for lookback intervals (left column, applied to both SP500 and UR) ranging from two to 12 months. “Either” beats buy-and-hold for seven of 11 lookback intervals. Trend following signals are generally better for longer than shorter lookback intervals (and also generate few switches).
Margins of victory for “Either” over buy-and-hold are modest and may not survive accounting for stocks-cash switching costs and tax impacts.
In summary, available evidence suggests that UR:SMA12 plus SP500:SMA10 is effective for timing the U.S. stock market during 2000-2010, but results for other decades back to 1950 are mixed.
Cautions regarding findings include:
- As noted, performance data do not account for costs of switching between stocks and cash, to the advantage of “Either” in comparison with buy-and-hold but to the disadvantage of “Either” in comparison with standalone timing scenarios.
- Modeling of SP500 dividends is crude, and the assumption of instant and frictionless dividend reinvestment is unrealistic for both SPY and SP500.
- As noted, calculations assume UR releases are available one to a few days before they actually are. More precise modeling of signal execution may affect results.
- As noted, long-term tests suggest that investors may not have discovered the Either scenario until after its most successful 2000-2010 decade.
- There may be snooping bias in selecting UR trend for combination with equity market SMA10. In other words, UR may have worked best from a set of other economic statistics.
- As noted, using longer-term U.S. Treasuries as the “safe” asset boosts performances of SPY timing scenarios. However, such bonds carry term risk (risk of capital loss) and have the tail wind of falling interest rates during most of the available sample period for SPY.
- A general concern with backtesting investment strategies using economic indicators is that as-revised (downloadable) economic series are sometimes not stable, including revisions made over several months and occasional overall series revisions when the government revises calculation methodologies. Such revisions impound look-ahead bias. For recent decades, there are BLS news releases announcing the unemployment rate which differ modestly from the downloadable file in a few cases. For more on this caution, see “Use the U.S. LEI for Long-term Stock Market Timing?” and “Real-time Economic Data and Future T-note Returns”.