A subscriber, noting an article on slowing down intrinsic (absolute or time series) momentum for SPDR S&P 500 (SPY) when its return volatility is relatively high, suggested doing the same for the Simple Asset Class ETF Momentum Strategy (SACEMS). The hypothesis is that this dynamic lookback interval approach avoids undesirable whipsaws when asset returns are volatile. SACEMS each month picks winners from the following set of exchange-traded funds (ETF) based on total returns over a fixed lookback interval:
PowerShares DB Commodity Index Tracking (DBC)
iShares MSCI Emerging Markets Index (EEM)
iShares MSCI EAFE Index (EFA)
SPDR Gold Shares (GLD)
iShares Russell 2000 Index (IWM)
SPDR S&P 500 (SPY)
iShares Barclays 20+ Year Treasury Bond (TLT)
Vanguard REIT ETF (VNQ)
3-month Treasury bills (Cash)
To investigate the suggested dynamic lookback interval, we each month:
- Calculate the average of the standard deviations of daily returns over the last 60 trading days for the individual risky assets (all except Cash).
- Calculate the average of these end-of-month averages over the past 12 months.
- Divide the current month average standard deviation by the 12-month average of averages to get a lookback interval factor.
- Multiply the baseline fixed lookback interval by the current lookback interval factor.
- Round the result to the nearest whole number of months as the current dynamic lookback interval.
We focus on gross compound annual growth rate (CAGR) and gross maximum drawdown (MaxDD) as key performance statistics for the Top 1, equally weighted (EW) Top 2 and EW Top 3 portfolios of monthly winners. Using daily and monthly total (dividend-adjusted) returns for the specified assets during February 2006 (limited by DBC) through August 2017, we find that:
Per prior SACEMS research, the baseline fixed lookback interval is five months. Dynamic lookback interval modeling assumptions permit initial determination of dynamic winners at the end of April 2007.
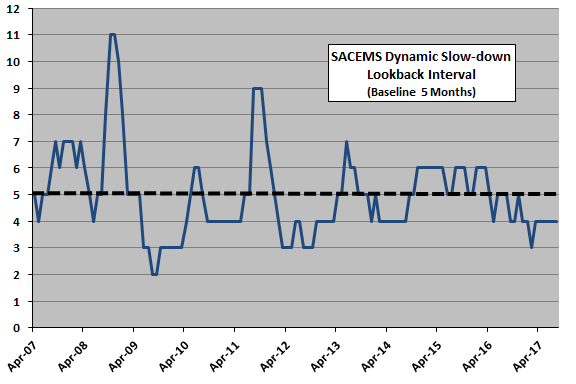
The following chart shows the specified dynamic lookback intervals as they vary above and below the 5-month baseline over the available sample period. When the equity market is particularly weak, as in late 2008 and late 2011, average asset class volatility increases and dynamic lookback interval lengthens. A longer lookback interval means slower response (Dynamic Slow-Down) to changes in return behavior. The average lookback interval is 5.0 months.
How does this lookback interval profile translate to SACEMS portfolio performance?
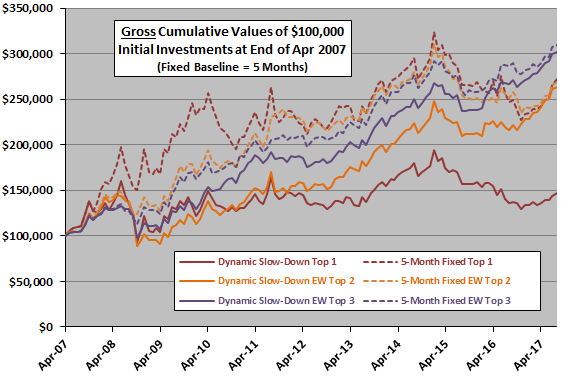
The next chart plots gross cumulative values for SACEMS with Dynamic Slow-Down (solid lines) and 5-Month Fixed (dashed lines) lookback intervals for Top 1, EW Top 2 and EW Top 3 portfolios over the available sample period. The dynamic versions mostly underperform their fixed counterparts, although not by much for EW Top 2 and EW Top 3. Top 1 dynamic exhibits particularly poor performance.
To quantify, we compare CAGRs and MaxDDs.
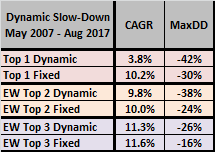
The following table summarizes key performance statistics for SACEMS Top 1, EW Top 2 and EW Top 3 portfolios with Dynamic Slow-Down or 5-Month Fixed lookback intervals over the available sample period. Notable points are:
- For each portfolio, dynamic lookback intervals generate a lower CAGR with a deeper MaxDD than its 5-month fixed lookback interval counterpart.
- Underperformance is modest for EW Top 2 and EW Top 3, emphasizing the importance of some portfolio diversification.
Since Dynamic Slow-Down underperforms, might the inverse outperform?
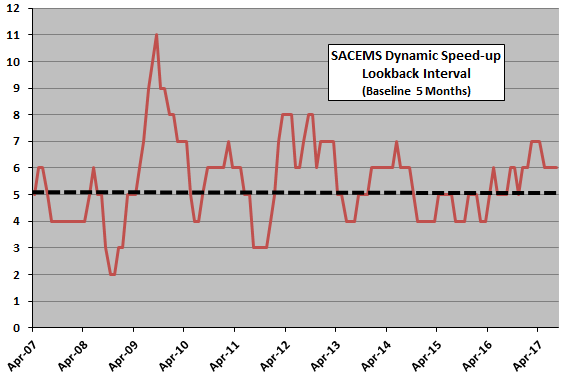
To test the inverse, we each month divide (rather than multiply) the baseline 5-month lookback interval by the lookback interval factor, thereby shortening the dynamic lookback interval when average asset class volatility is high. A shorter lookback interval means faster response (Dynamic Speed-Up) to changes in return behavior.
The next chart shows Dynamic Speed-Up lookback intervals as they vary above and below the 5-month baseline over the available sample period. When the equity market is particularly weak, as in late 2008 and late 2011, average asset class volatility increases and dynamic lookback interval shrinks. The average lookback interval is 5.5 months.
How does this lookback interval profile translate to SACEMS portfolio performance?
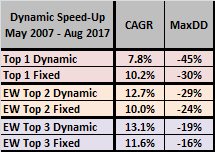
The following table summarizes key performance statistics for SACEMS Top 1, EW Top 2 and EW Top 3 portfolios with Dynamic Speed-Up or 5-Month Fixed lookback intervals over the available sample period. Notable points are:
- Dynamic lookback intervals again clearly underperform the fixed interval for Top 1 based on both CAGR and MaxDD.
- However, dynamic lookback intervals substantially outperform the fixed interval for EW Top 2 and EW Top 3 based on CAGR, with only modestly deeper MaxDDs.
It may be that Dynamic Speed-Up works better than Dynamic Slow-Down because rapid response to crashes is more important than avoiding whipsaws in the available sample.
As a robustness test, we look at Dynamic Speed-Up for a narrower group of SACEMS asset class ETFs with longer available histories.
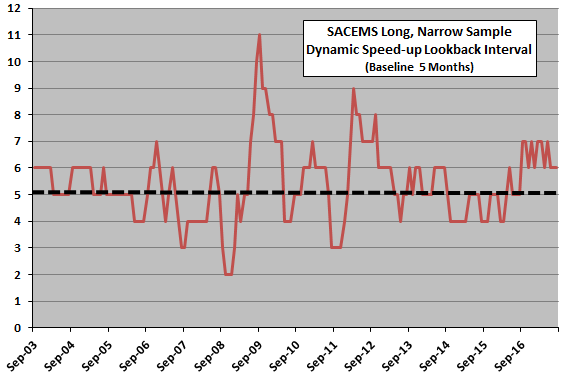
The next chart shows Dynamic Speed-Up lookback intervals as they vary above and below the 5-month baseline as applied only to Cash, SPY, IWM, EFA and TLT over a sample period commencing at the end of July 2002. The average lookback interval is 5.4 months.
How does this lookback interval profile translate to narrowed SACEMS portfolio performance?
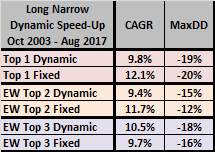
The following table summarizes key performance statistics for narrow SACEMS Top 1, EW Top 2 and EW Top 3 portfolios with Dynamic Slow-Down or 5-Month Fixed lookback intervals over the available sample period. Notable points are:
- For Top 1 and EW Top 2 portfolios, dynamic lookback intervals generate substantially lower CAGRs with similar MaxDDs than their 5-month fixed counterparts.
- For EW Top 3, dynamic lookback intervals modestly outperform based on CAGR, but with a slightly deeper MaxDD. Since only five assets are available, an EW Top 3 portfolio may not make momentum sense.
In summary, evidence on the value of slowing down (speeding up) SACEMS momentum calculations when asset class volatilities are relatively high is negative (mixed) for available samples. The case for adding monthly calculation burdens and potential sources of model/data snooping bias is weak overall.
Cautions regarding findings include:
- The available sample periods (about 10 years and 14 years) are short for reliable testing, comprising only 10 and 14 independent average of averages volatility lookback intervals.
- Other combinations of (1) baseline lookback interval, (2) asset class ETF volatility lookback interval, (3) longer run average of averages volatility lookback interval and (4) asset universes may work better. However:
- The selected 60-day and 12-month volatility calculation intervals may impound indirect snooping bias derived from experience working with similar data.
- Experimenting with the four sources of variation would add direct snooping bias, rapidly for the short sample period.
- Monthly calculations for dynamic lookback intervals are burdensome compared to a fixed lookback interval.
See also “Asset Class Momentum Faster During Bear Markets?”.