As implied in “Mirror Image Seasonality for Stocks and Treasuries?”, are bonds better than stocks during the “Sell-in-May” months of May through October? Are behaviors of government, corporate investment grade and corporate high-yield bonds over this interval similar? To investigate, we test seasonal behaviors of:
SPDR S&P 500 (SPY)
Vanguard Intermediate-Term Treasury (VFITX)
Fidelity Investment Grade Bond (FBNDX)
Vanguard High-Yield Corporate Bond (VWEHX)
Using dividend-adjusted monthly prices for these funds during January 1993 (limited by SPY) through January 2020, we find that:
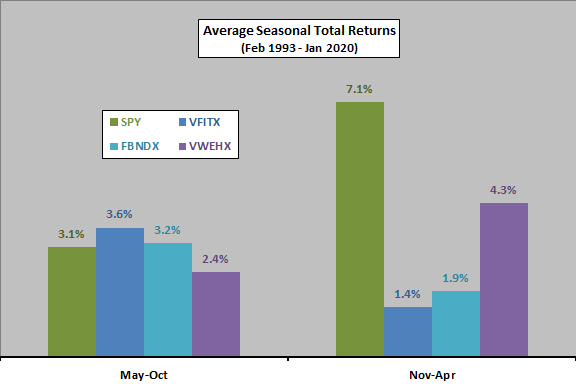
The following chart compares average returns by season (May-October and November-April) for SPY, VFITX, FBNDX and VWEHX over the full sample period. To exclude partial seasons, calculations run from the end of April 1993 through the end of October 2019. Results support belief that, on average:
- U.S. stocks are stronger during November-April than May-October.
- Safe U.S. Treasuries and investment grade corporate bonds exhibit opposite seasonality from stocks.
- High-yield U.S. corporate bonds are more stock-like than safe bonds.
During May-October, SPY outperforms VFITX 18 of 27 years, but the three worst semiannual SPY returns occur during this half of the year.
During November-April, SPY outperforms VFITX 22 of 26 years, and four of the five best semiannual SPY returns occur during this half of the year.
For greater granularity, we look at monthly returns.

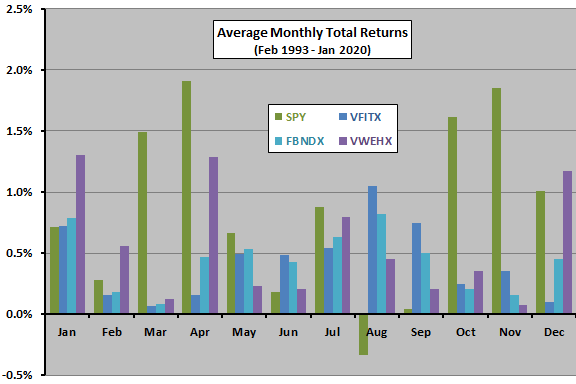
The next chart compares average returns by calendar month for SPY, VFITX, FBNDX and VWEHX over the available sample period. Results indicate that, on average:
- Stocks outperform all bond funds in March, April, May, July, October and November.
- Both safe bond funds outperform stocks in January, June, August and September.
- The high-yield bond fund is the top performer in January, February and December.
In other words, at a monthly level, conventional seasonal patterns for stocks and safe bonds fit somewhat, but not perfectly. It appears that, for this sample, October belongs solidly in stocks season.
Correlations between average calendar month SPY returns and average calendar month returns for VFITX, FBNDX and VWEHX are -0.69, -0.54 and +0.15, respectively, confirming that high-yield bond seasonality is more stock-like than safe bond seasonalities.
For a perspective on exploitability, we look at several portfolios.

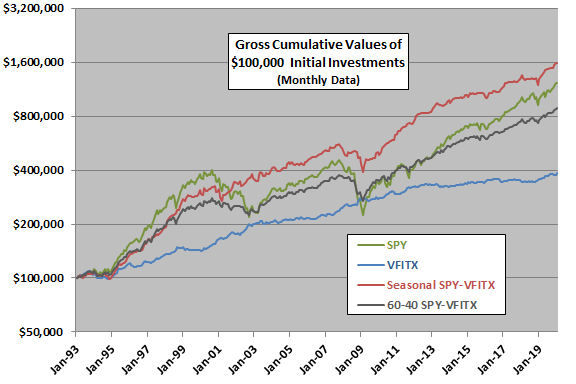
The final chart compares growth of $100,000 initial investments at the end of January 1993, measured monthly, in four portfolios:
- SPY – buy and hold SPY.
- VFITX – buy and hold VFITX.
- Seasonal SPY-VFITX – hold SPY during November-April and VFITX during May-October.
- 60-40 SPY-VFITX – start with 60% SPY-40% VFITX and rebalance to these allocations semiannually at the end of each April and October.
Seasonal SPY-VFITX is relatively attractive.

The following table summarizes gross performance statistics associated with the preceding chart. Annual Sharpe ratio (calculated for years from February through January to maximize data use) employs annual average monthly 3-month U.S. Treasury bill yield during a year as the risk-free rate for that year. Results confirm that Seasonal SPY-VFITX beats SPY and 60-40 SPY-VFITX.

In summary, evidence from simple tests on a limited sample suggest that safe bonds tend to outperform both stocks and high yield bonds during the May-October off-season for stocks.
Cautions regarding findings include:
- The sample period is short for calendar-based analysis. As described in “Stock and Bond Returns Correlation Variability”, the stocks-bonds correlation is not stable, so results may differ for other periods.
- As noted, calculations assume no costs for switching or rebalancing funds. The low frequency of actions mitigates this concern.
- Results for other stock and bond funds may differ.