Does conventional reward-for-risk wisdom about the long-run performance of the U.S. stock market translate to the typical stock? In the May 2018 update of his paper entitled “Do Stocks Outperform Treasury Bills?”, Hendrik Bessembinder compares the performance of the typical U.S. stock to that of the 1-month U.S. Treasury bill (T-bill) over monthly, annual, decade and life-of-stock horizons. He also performs simulations to gauge the effectiveness of holding just one stock and of diversifying across portfolios of five, 25, 50 and 100 stocks. Using monthly total (dividend-reinvested) returns for 25,967 U.S. common stocks while listed during July 1926 through December 2016, he finds that:
- The cross-sectional distribution of monthly stock returns is positively skewed, with large positive returns for a few stocks offsetting modest or negative returns for typical stocks. Compounding amplifies skewness.
- Based on monthly returns:
- 47.8% of stocks beat T-bills.
- 46.3% beat the value-weighted market.
- 45.9% beat the equal-weighted market.
- Only for the top four tenths (deciles) of stocks sorted by market capitalization (size) do more than half beat T-bills.
- Based on annual returns:
- 51.6% of stocks beat T-bills.
- 44.4% beat the value-weighted market.
- 42.5% beat the equal-weighted market.
- Only for the top six size deciles do more than half beat T-bills.
- Based on 10-year returns:
- 49.5% of stocks beat T-bills.
- 37.3% beat the value-weighted market.
- 33.6% beat the equal weighted market.
- Only for the top four size deciles do more than half beat T-bills. The decile of the largest stocks performs best, with nearly 70% beating T-bills.
- Based on stock lifetime (listing to delisting, median 7.5 years) returns:
- 42.6% of stocks beat T-bills (and less than half have positive returns).
- 30.8% beat the value-weighted market.
- 26.1% beat the equal-weighted market.
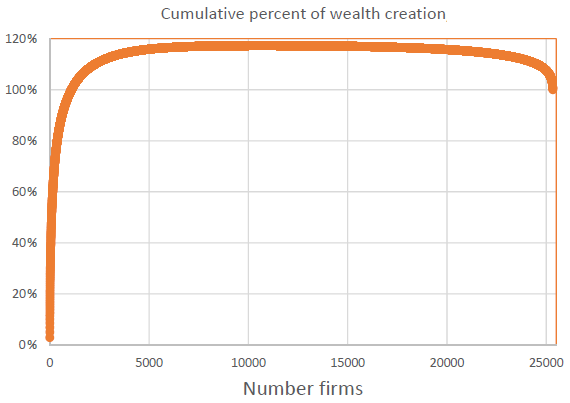
- The top five, 90 and 1,092 stocks (about 4%) account for 10%, over 50% and all net wealth creation over the full sample period (see the chart below).
- The percentage of stocks with lifetime returns below the return on T-bills is highest for those listing in recent decades.
- Failing to diversify enough to include the relatively few stocks that (retrospectively) generate very large cumulative returns is risky. In 10-year simulations, a strategy that each month randomly picks:
- One listed stock on average beats T-bills (the value-weighted market) 47.8% (29.4%) of the time.
- 25 listed stocks on average beats T-bills (the value-weighted market) 86.9% (45.4%) of the time.
- 100 listed stocks on average beats T-bills (the value-weighted market) 93.1% (47.5%) of the time.
The following chart, taken from the paper, plots cumulative percentage of net U.S. stock market wealth creation during 1926-2016 from 25,332 individual stocks sorted from largest to smallest wealth creation. The value exceeds 100% because many stocks with the smallest wealth creation make negative contributions. As noted above, a relatively few stocks account for most of the wealth creation.

In summary, evidence indicates that investors should not attribute conventional wisdom about equity market returns to individual stocks and, if they cannot pick top stocks in advance, should remain broadly diversified.
Cautions regarding findings include:
- Systematic reinvestment of all dividends, as assumed, may be problematic in terms of trade size, trading frictions and market capacity to absorb all dividends.
- For much of the sample period, there is no cheap way to hold the broad U.S. stock market. The author therefore overstates practical market returns, substantially for the monthly rebalanced equal-weighted portfolio of all stocks.