Can speculators squeeze the “insurance” premium from shorting equity index put options in just the few days before expiration? In their January 2017 paper entitled “The Timing of Option Returns”, Adriano Tosi and Alexandre Ziegler investigate the timing of returns from shorting out-of-the-money (OTM) S&P 500 Index put options. Specifically, they compute daily excess returns (accruing return on cash for open short positions) for the two front contracts (“front-month” and “back-month”) up through expiration. They translate findings into strategies that open equally weighted short positions in the most liquid OTM puts a certain number of days before expiration and hold to the cash-settled expiration. They also consider delta-hedged positions via long S&P 500 Index futures. In most calculations, they account for market frictions by opening (closing) short positions at the bid (ask). Using daily data for S&P 500 Index levels, options and futures, and contemporaneous stock and option pricing model factors, as available during January 1996 through August 2015, they find that:
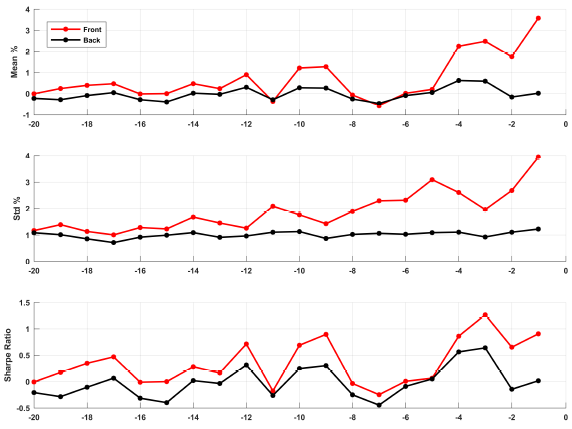
- Short positions in front -month S&P 500 Index OTM put options generate attractive average returns only on days near expiration, and back-month positions do not produce attractive average daily returns (see the first three charts below).
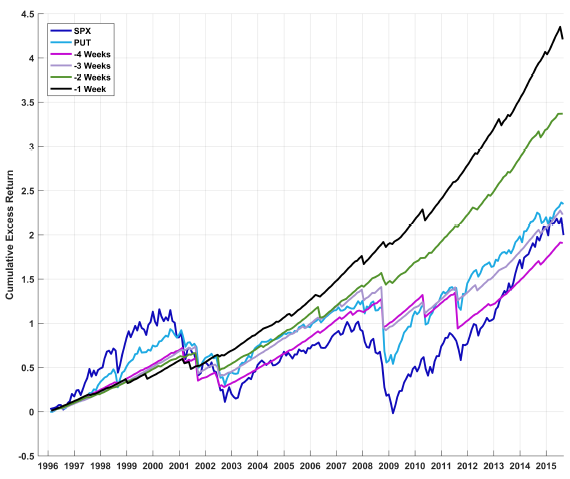
- A trading strategy that shorts OTM put options (see the last chart below):
- Four weeks before expiration and holds to expiration generates average annual return 5.5% with annual Sharpe ratio 0.66.
- One week before expiration and holds to expiration generates average annual return 8.7% with annual Sharpe ratio 2.8, translating to 7%-8% annualized alphas across all factor models of returns.
- One day before expiration and holds to expiration generates average annual return 6.6% with annual Sharpe ratio 0.95, translating to 4%-7% annualized alphas across all factor models of returns.
- Two months before expiration and holds for one month generates average annual return 0.4% with annual Sharpe ratio 0.06.
- However, systematically shorting S&P 500 Index OTM put options suffers rare steep drawdowns.
- Findings generally hold for positions delta-hedged by long F&P 500 Index futures.
- Concentration of the index put option “insurance” premium close to expiration reflects heightened sensitivity of the option prices to sharp moves in the underlying index.
- An approach that shorts deeper OTM put options when S&P 500 Index implied volatility (VIX) is higher improves strategy performance.
- Returns for systematically selling S&P 500 Index:
- OTM calls exhibit a daily pattern similar to that for OTM puts, but the “greed” premium earned is smaller.
- ATM puts and calls exhibit a daily pattern similar to that for OTM puts, but the premiums earned are smaller and drawdowns more frequent.
- ITM puts and calls exhibit no daily patterns and earns barely any premiums.
The following three charts, taken from the paper, summarize gross performance statistics for equally weighted portfolios of short positions in liquid front-month (back-month) S&P 500 Index OTM put options by days before expiration (before becoming front-month) over the sample period. Daily entries/exits are at bid-ask midpoints. The upper chart shows gross annualized average return, the middle chart shows return variability (standard deviation) and the bottom chart shows gross annualized Sharpe ratio by day. Results show that attractive excess returns and Sharpe ratios concentrate in the front-month near expiration, even though return variability also increases.

The next chart, also from the paper, compares cumulative excess returns of the S&P 500
total return index (SPX), the CBOE PutWrite Index (denoted PUT) and portfolios of equally weighted short positions in liquid S&P 500 Index OTM put options sold at the Friday closing bid 4, 3, 2 and 1 week before expiration and held to expiration (cash settlement price). Results indicate that profitability of shorting equity index OTM put options strengthens as expiration nears (but the strategy is subject to large, sharp drawdowns).

In summary, evidence indicates that speculators seeking to harvest the “insurance” premium from selling equity index OTM put options should sell during the last few days before expiration, and investors seeking downside risk protection should use back-month options to reduce hedging costs.
Cautions regarding findings include:
- When accounting for “transaction costs,” the authors mean bid-ask spread. They do not account for broker fees or impact of trading (capacity limits).
- The paper computes returns from committed funds, not expected liabilities with drawdowns. As noted, selling equity index OTM put options involves large downside risk. Holding a cash reserve to recover from strategy blow-ups would reduce overall average return and Sharpe ratio.
For related research see:
- “Profitability of Systematically Selling Equity Index Put and Call Options”
- “Buying and Selling Crash Insurance (Tail Risk Protection)”
- “Strategy Test” (shorting covered equity index put options)
- “Is 40% Per Month Shorting Index Puts a Fair Return?”
- “Abnormal Returns from Selling Index Put Options?”