Is systematically selling cash-covered equity index put options an attractive strategy? In his January 2016 paper entitled “An Analysis of Index Option Writing with Monthly and Weekly Rollover”, Oleg Bondarenko analyzes the performance of the CBOE S&P 500 PutWrite Index (PUT), launched in 2007, and the CBOE S&P 500 One-Week PutWrite Index (WPUT), launched in 2015. These indexes track gross performance of a strategy that each month (for PUT) or each week (for WPUT) sells at-the-money S&P 500 Index options fully secured at sale by U.S. Treasury bills (T-bills) and holds to cash settlement at expiration. His principal benchmark is the S&P 500 Total Return Index. Using monthly price history for PUT since the end of June 1986 and weekly price history for WPUT since the end of January 2006 all through December 2015, he finds that:
- During February 2006 through December 2015, PUT and WPUT outperform the underlying S&P 500 Total Return Index on a gross, risk-adjusted basis. For PUT, WPUT and the S&P 500 Total Return Index, respectively (see also the table and chart below):
- Gross annual compound returns are 6.6%, 5.6% and 7.1%.
- Annualized return standard deviations are 11.5%, 9.8% and 15.1%.
- Gross annualized Sharpe ratios are 0.52, 0.50 and 0.46.
- Maximum drawdowns are -33%, -24% and -51%.
- During July 1986 through December 2015, PUT outperforms the underlying S&P 500 Total Return Index on a gross, risk-adjusted basis. For PUT and the S&P 500 Total Return Index, respectively :
- Gross annual compound returns are 10.1% and 9.8%.
- Annualized return standard deviations are 10.1% and 15.3%.
- Gross annualized Sharpe ratios are 0.67 and 0.47.
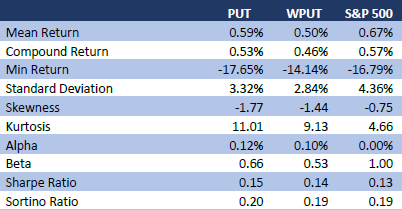
The following table, extracted from the paper, summarizes gross monthly performance statistics for PUT, WPUT and the S&P 500 Total Return Index during February 2006 through December 2015.

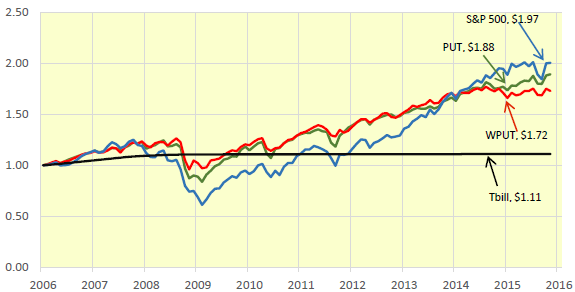
The following chart, taken from the paper, compares gross cumulative values of $1 initial investments in PUT, WPUT, the S&P 500 Total Return Index and T-bills over the available sample period. The S&P 500 Total Return Index achieves the highest gross terminal value, but lags PUT and WPUT during much of the sample period.

In summary, evidence indicates that systematically selling cash-covered put options on the S&P 500 Index has attractive gross risk-adjusted performance compared to the underlying index.
Cautions regarding findings include:
- Performance data are gross, not net. Options generally have high trading frictions compared to stocks, and the turnovers of PUT and WPUT are much higher than that of the underlying S&P 500 Index. In fact, one finding in the closely related “Simple Stock Index Option Strategies” is that exchange-traded products designed to track the CBOE S&P 500 BuyWrite Index (BXM) substantially underperform BXM.
- As indicated, much of the historical price “histories” for PUT (before 2007) and WPUT (before 2015) are constructed retroactively. The indexes and any funds that track them provided no feedback to the market before launch. Such feedback may alter index behaviors.
See “Simple Stock Index Option Strategies” for comparable analyses.