Are high-frequency sentiment feeds useful in predicting stock market behavior? In the November 2015 version of their paper entitled “Stock Return Predictability and Investor Sentiment: A High-Frequency Perspective”, Licheng Sun, Mohammad Najand and Jiancheng Shen measure the predictive power of half-hour changes in investor sentiment for subsequent half-hour U.S. stock market returns during the trading day. Their intraday sentiment is based on the Thomson Reuters MarketPsych Indices (TRMI), which provide textual analysis of news wires, internet news sources and social media. They test exploitability via a strategy that buys (sells) SPDR S&P 500 (SPY) during each of the last four half-hours of the trading day when the preceding change in sentiment predicts a positive (negative) return. Using intraday TRMI data aggregated in half-hours and intraday half-hour returns for SPY during 1998 to 2011, they find that:
- Prior half-hour change in investor sentiment predicts intraday half-hour SPY returns, most notably for the last four half-hour intervals.
- This high-frequency sentiment effect is independent of intraday momentum based on lagged half-hour returns. Moreover, the latter effect is evident only for the last half-hour of the trading day, while the former is strong over the last two hours.
- While the high-frequency sentiment effect is stronger during the summer and during economic expansions, it appears during most months and most days of the week.
- Neither macroeconomic indicators nor alternative sentiment measures explain the predictive power of high-frequency sentiment.
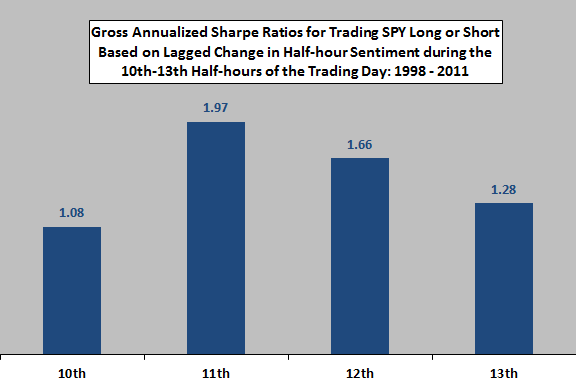
- High-frequency sentiment supports a trading strategy during the last two hours of the trading day that is attractive on a gross basis (see the chart below).
The following chart, constructed from data in the paper, summarizes gross annualized Sharpe ratios for a strategy that buys (sells) SPY during the last two hours of the trading day when a regression versus prior half-hour change in investor sentiment predicts a positive (non-positive) half-hour return. Trading is very frequent, such that frictions may offset profits.

In summary, evidence indicates that investors bearing very low data costs and trading frictions may be able to exploit high-frequency sentiment data to time the U.S. stock market late in the trading day.
Cautions regarding findings include:
- As noted, reported trading strategy performance is gross, not net. Accounting for high-frequency data costs (which may be substantial) and trading frictions would reduce performance.
- Given the pace of advancements in high-frequency trading, data used in the study may be stale.