Can investors refine and exploit the upward bias of overnight stock returns? In the July 2015 version of her paper entitled “Night Trading: Lower Risk but Higher Returns?”, Marie-Eve Lachance presents a way of sorting stocks by strength of overnight return bias and investigates gross and net profitability of associated overnight-only investment strategies. Specifically, she each month regresses daily overnight returns on total returns over the past year to measure an Overnight Bias Parameter (OBP) for each stock. She then forms portfolios based on monthly OBP sorts, focusing on the portfolio of stocks with significantly positive OBPs. She estimates trading frictions by: (1) assuming market-on-open and market-on-close trades, avoiding bid-ask spreads; and, (2) estimating broker charges from the lowest fees available in the U.S. in 2014. Using daily overnight (close-to-open) and intraday (open-to-close) total returns, trading data and characteristics for a broad sample of reasonably liquid U.S. stocks during 1995 through 2014, she finds that:
- Over the entire sample period, the annualized value-weighted overnight (intraday) return is 6.84% (3.72%), with associated daily volatility 1.45% (2.60%). Overnight returns are less volatile than intraday returns for 98% of stocks.
- OBP exhibits a strong positive (negative) relationship with future overnight (intraday) monthly returns at horizons of one to 60 months.
- The tenth of stocks with the highest prior-month OBP generates a gross annualized value-weighted overnight (intraday) return of 40.4% (-22.1%). For the tenth of stocks with the lowest prior-month OBP, overnight (intraday) gross annualized returns are -17.1% (33.1%). Intervening decile portfolios exhibit smooth progression between these two extremes.
- About 20% of stocks in the sample have significantly positive prior-year OBPs. A portfolio of this Overnight Bias Group (OBG), reformed monthly:
- Generates 25.9% gross annualized value-weighted overnight return and 20.1% four-factor (market, size, book-to-market, momentum) gross annualized value-weighted alpha.
- Has market beta 0.31 and annualized standard deviation 11.5%.
- Produces positive gross alphas in each of the 20 years of the sample (and negative intraday returns in 18 of 20 years).
- For comparison, a full-day investment in the market portfolio has annualized return 10.0% with annualized standard deviation 19.3%.
- Estimated daily round-trip trading frictions are 0.015% and 0.031% for position sizes of $100,000 and $10,000, respectively. Based on these estimates, the OBG overnight strategy generates net annualized returns (alphas) in the range 15.7% to 21.2% (10.4% to 15.7%). Holding non-OBG stocks overnight is generally unprofitable.
- A portfolio that is long OBG stocks and short stocks with significantly negative prior-month OBPs, rebalanced monthly, generates a 43.1% gross annualized return, with annualized standard deviation only 6.6% and gross four-factor alpha 42.3%. Net annualized returns (alphas) are in the range 21.3% to 32.5% (20.6% to 31.8%).
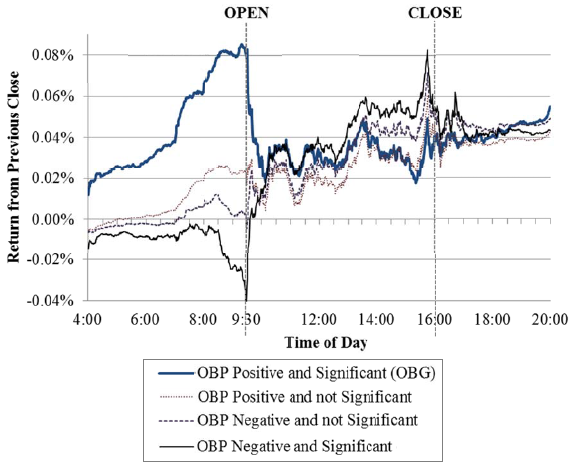
- On average, abnormal overnight returns for OBG stocks peak minutes before the market open and dissipate soon after the open. Traders can avoid intraday losses for these stocks by waiting 30-45 minutes after the open to buy them (see the chart below).
- Findings for OBG stocks are robust to: using equal-weighted instead of value-weighted returns; excluding stocks that are illiquid or have low share prices; excluding earnings announcement days; and, different market (bull-bear) and economic (expansion-contraction) conditions.
- Findings also broadly hold for stocks in major indexes of 23 developed countries (including the U.S.) during 2002 through 2014. Specifically:
- The overall gross annualized overnight (intraday) return is 18.8% (-9.3%).
- Overnight returns beat intraday returns in all 23 countries.
- The fourth of stocks with the highest prior-month OBPs, reformed monthly, generates a gross annualized overnight (intraday) return of 43.7% (-24.8%).
The following chart, extracted from the paper, summarizes value-weighted average minute-by-minute total return trajectories for four groups of U.S. stocks resorted monthly based on prior-year OBP during January 2010 through December 2012 (excluding the May 6, 2010 flash crash). Results indicate that:
- Prior-year OBP is an effective indicator of future overnight returns.
- Abnormal overnight returns for the significantly positive and significantly negative OBP groups reach extremes at about the market open.
- Abnormal overnight returns revert quickly after the open, disappearing in about 45 minutes.
- All four groups subsequently have similar returns until after market close, but OBG stocks may have the largest selling pressure in mid-afternoon.

In summary, evidence indicates that that the overnight stock return anomaly is pervasive, predictable by stock and potentially very profitable.
Cautions regarding findings include:
- As noted in the paper, market-on-open and market-on-close trading (to avoid bid-ask spreads) may not support large trades in some OBP stocks. Substantial aggregate growth in such trading may induce market changes.
- Also as noted in the paper, net performance calculations assume optimally low 2014 trading costs retroactively as far back as 1995, thereby overstating achievable real-time profitability. Trading cost estimates also assume considerable capital to hold many $10,000 or $100,000 positions for reliable results.
- Estimating stock-by-stock OBP is data/computation-intensive and beyond the reach of many investors. Delegating calculations and associated executions to an investment manager would involve fees.
See also “Momentum Happens at Night?” and “Buy at the Close and Sell at the Open?”.