Does the interaction of paradigmatic indicators of optimism (lumber demand) and pessimism (gold demand) tell investors when to take risk and when to avoid risk? In their May 2015 paper entitled “Lumber: Worth Its Weight in Gold: Offense and Defense in Active Portfolio Management”, Charles Bilello and Michael Gayed examine the recent relative performance of lumber (a proxy for economic activity via construction) and gold (a safe haven) as an indicator of future stock market and bond market performance. Specifically, if lumber futures outperform (underperform) spot gold over the prior 13 weeks, they go on offense (defense) the next week. They test this strategy on combinations of seven indexes comprising a spectrum of risk (listed lowest to highest): BofA Merrill Lynch 5-7 Year Treasury Index (Treasuries); CBOE S&P 500 Buy-Write Index (BuyWrite); S&P 500 Low Volatility Index (Low Volatility); S&P 500 Index (SP500); Russell 2000 Index (R2000); Morgan Stanley Cyclicals Index (Cyclicals); and, S&P 500 High Beta Index (High Beta). Using weekly nearest futures contract prices for random length lumber, weekly spot gold prices and weekly total returns for the seven test indexes during November 1986 (November 1990 for Low Volatility and High Beta) through January 2015, they find that:
- The lumber-gold relationship predicts U.S. stock market states:
- Realized volatility and implied volatility are on average substantially lower during weeks after lumber outperforms.
- 74% (87%) of the worst 5% (1%) of weeks for the S&P 500 Index occur after gold outperforms.
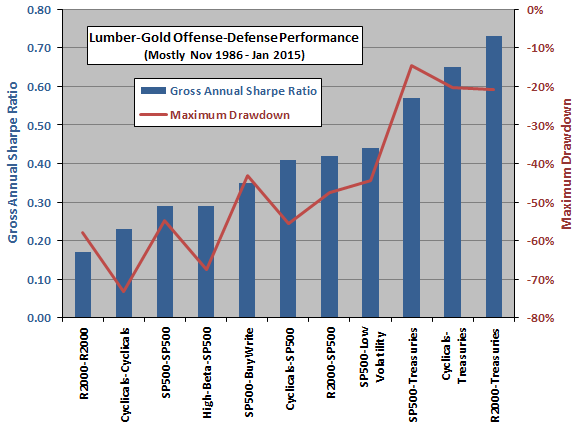
- A strategy that goes on offense after lumber outperforms gold and/or defense after lumber underperforms gold generally produces stronger absolute and risk-adjusted performance than buying and holding stock indexes (see the chart below).
- Results are robust to various time frames and across multiple economic and financial market cycles.
The following chart, constructed from data in the paper, summarizes gross annual Sharpe ratios and maximum (peak-to-trough) drawdowns for 11 offense-defense portfolios, reformed weekly. For each portfolio, the first index is that held when lumber futures outperform spot gold over the prior 13 weeks, and the second index is that held when spot gold outperforms lumber futures over the prior 13 weeks. Buy-and-hold benchmarks are those with the first and second indexes the same. Results indicate that:
- Timed offense and defense generally beat buy-and-hold on a gross basis.
- The best strategies use Treasuries rather than defensive stocks on defense.

In summary, evidence suggests that investors may be able to time financial markets by holding risk-on (risk-off) assets when lumber outperforms (underperforms) gold in the recent past.
Cautions regarding findings include:
- Tests employ indexes rather than tradable assets, thereby ignoring the costs and fees of maintaining a liquid fund. These expenses would reduce performance for all portfolios and may vary materially across indexes.
- Tests ignore the trading frictions associated with switching between offense and defense. These frictions would further reduce performance for switching strategies. While noting that turnover depends on the length of the interval used to measure lumber-gold relative performance, the authors do not quantify turnover.
- Testing many strategies on the same or similar data introduces snooping bias (luck), such that the best-performing strategy likely overstates expectations.
- There may be snooping bias in selection of the 13-week interval to measure lumber-gold relative performance. The authors state that “…time frames as short as 3 weeks and as long as 21 weeks also have predictive power.” However, they do not quantify sensitivity of performance to length of measurement interval.
- Interest rates generally decline over the entire sample period, supporting a bull market for Treasuries (the defensive component of the top three asset combinations). Interest rates may not continue to fall in the future.