“Simple Asset Class ETF Value Strategy” (SACEVS) finds that investors may be able to exploit relative valuation of the term risk premium, the credit (default) risk premium and the equity risk premium via exchange-traded funds (ETF). However, the backtesting period is limited by available histories for ETFs and for series used to estimate risk premiums. To construct a longer test, we make the following substitutions for potential holdings (selected for length of available samples):
- Monthly average 3-Month Treasury Bill (T-bill) Secondary Market Rate instead of monthly average 3-Month T-bill Constant Maturity Rate as the risk-free rate and return on Cash.
- Vanguard GNMA Investor Shares (VFIIX) instead of iShares 20+ Year Treasury Bond (TLT).
- Vanguard Long-Term Investment Grade Investor Shares (VWESX) instead of iShares iBoxx $ Investment Grade Corporate Bond (LQD).
- Vanguard 500 Index Fund Investor Shares (VFINX) instead of SPDR S&P 500 (SPY).
To enable estimation of risk premiums over a longer history, we also substitute:
- Monthly average Moody’s Seasoned Baa Corporate Bond Yields rather than day before end-of-month Baa yields for calculation of the credit risk premium. This substitution ignores a one-day delay in release of daily data.
- Robert Shiller’s S&P Composite Index monthly average levels instead of S&P 500 Index monthly closes. This substitution ignores any delay in posting of Shiller data (but new data are available elsewhere in real time).
- Robert Shiller’s monthly S&P Composite Index (GAAP, or as-reported) earnings instead of S&P Dow Jones S&P 500 operating earnings. We lag the Shiller earnings by four months to ensure real-time availability. In other words, the earnings yield for a month is the S&P Composite Index level for that month divided by index annual GAAP earnings as of four months ago. GAAP earnings are generally lower than operating earnings (see “Stock Market Valuation Ratio Trends”).
- Robert Shiller’s monthly average Long Interest Rates instead of monthly average yields on 10-year Constant Maturity U.S. Treasury notes. This substitution ignores any delay in posting of Shiller data (but new data are again available elsewhere with little delay).
As with ETFs, we consider two alternatives for exploiting premium undervaluation: Best Value, which picks the most undervalued premium; and, Weighted, which weights all undervalued premiums according to degree of undervaluation. Based on the assets considered, the principal benchmark is a monthly rebalanced portfolio of 60% VFINX and 40% VFIIX. Using monthly risk premium calculation data during March 1934 through November 2020 (limited by availability of T-bill data), and monthly dividend-adjusted closing prices for the three asset class mutual funds during June 1980 through November 2020 (40+ years, limited by VFIIX), we find that:
We measure the three risk premiums as follows:
- The term risk premium for a month is the difference between average Long Interest Rate and average T-bill yield during that month.
- The credit risk premium for a month is the difference in average Moody’s Baa bond yield and average Long Interest Rate during that month. This definition assumes investors hold corporate bonds as a risky alternative to U.S. Treasuries of comparable duration.
- The equity risk premium for a month is the difference between the S&P Composite Index earnings yield at the end of the month (with lagged earnings, as specified above) and the average Long Interest Rate during that month. This definition assumes investors hold stocks over an extended period (10 years) as a risky alternative to U.S. Treasuries.
To determine whether any current risk premium is undervalued or overvalued for a month, we subtract its average value over months for the prior 10 years (the Shiller “cycle”) from its current value and divide this difference by its standard deviation over months for the prior 10 years. The result is number of standard deviations above (positive values) or below (negative values) its average for the prior decade. Positive values indicate undervaluation of the premium, because the associated yield is “too high.” We later test sensitivity to length of lookback interval.
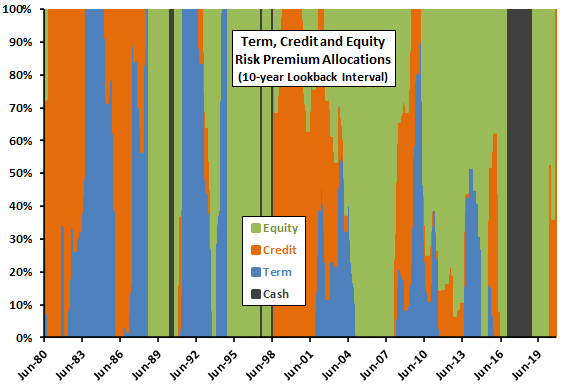
The Best Value strategy each month allocates all funds to the asset corresponding to the risk premium with the greatest undervaluation at the end of the preceding month: VFIIX if the term risk premium is most undervalued; VWESX if the credit risk premium is most undervalued; VWUSX if the equity risk premium is most undervalued; and, Cash if none of the risk premiums are undervalued. Since June 1980, the best value is Cash during 57 months, VFIIX during 119 months, VWESX during 130 months and VWUSX during 180 months.
The Weighted strategy each month allocates funds to assets corresponding to all undervalued risk premiums by dividing level of preceding month undervaluation for each (in standard deviations, as above) by the sum of all undervaluations.
The following chart tracks allocations to risk premiums per this strategy since June 1980. It appears that the model is as attentive to bond premiums as it is to the equity premium. Recent emphasis on Cash is different from the ETF version.
How do these two strategies translate into cumulative performance?
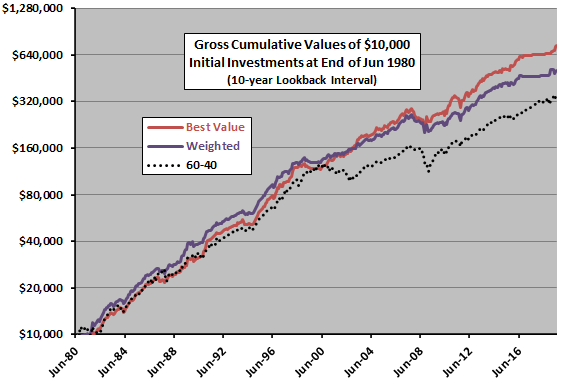
The next chart compares on a logarithmic scale gross cumulative values of $10,000 initial investments in the two risk premium valuation strategies and the 60-40 benchmark over the available test period. Calculations derive from the following assumptions:
- Reallocate/rebalance at the close on the last trading day of each month (assume that all data can be accurately estimated just before the close).
- Ignore trading frictions for making position changes.
- Ignore any tax implications of trading.
Results indicate that both the Best Value and Weighted strategies add value. Compound annual growth rates are 11.8%, 10.2% and 9.6% for Best Value, Weighted and 60-40, respectively.
The Best Value strategy switches funds 62 times over the 40-year period, so trading frictions are low. These infrequent signals suggest that signal execution delays would have little effect.
Maximum (peak-to-trough) drawdowns are -27%, -24% and -31% for Best Value, Weighted and 60-40, respectively.
How do average monthly returns, as alternative measures of performance, compare?
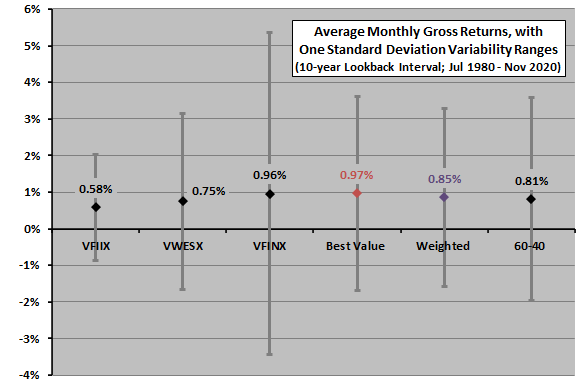
The next chart summarizes average monthly gross returns and standard deviations of monthly returns for the mutual fund components, the Best Value and Weighted strategies and the 60-40 benchmark. Rough gross monthly Sharpe ratios (average monthly return divided by standard deviation of returns) for Best Value, Weighted and 60-40 are 0.36, 0.35 and 0.29, respectively.
Is the relative value effect consistent over time?
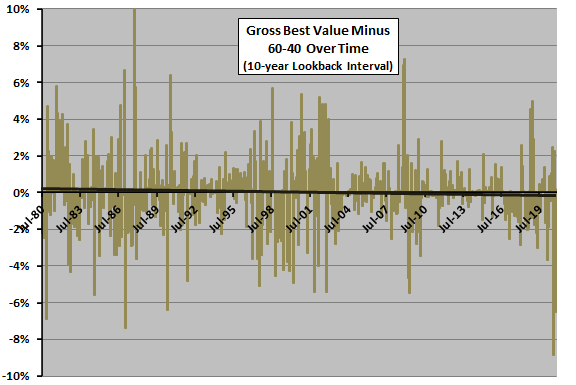
The next chart shows Best Value monthly gross returns minus 60-40 monthly gross returns over the available sample period, along with a best-fit trend line. Best Value outperforms 60-40 by an average 0.16% per month, winning 54% of all months. Results suggest outperformance of Best Value dissipates over time.
Weighted outperforms 60-40 by an average 0.04% per month, winning 53% of all months.
Are findings sensitive to the look-back interval used to assess risk premium valuation?
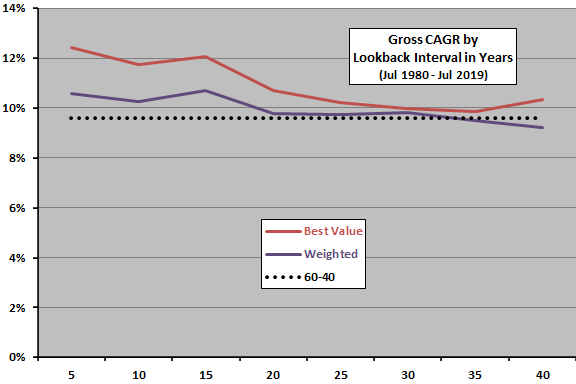
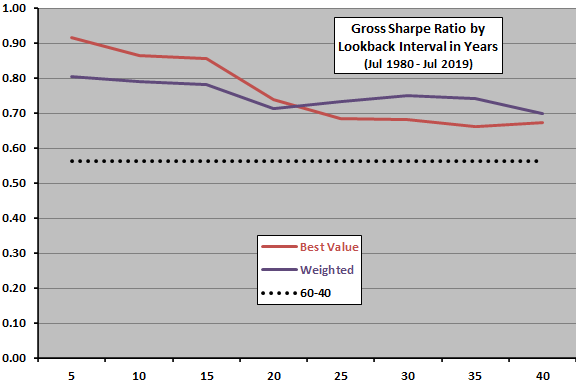
The final two charts compare gross CAGRs (upper chart) and gross annual Sharpe ratios (lower chart) for the Best Value and Weighted active strategies and the 60-40 benchmark using different lookback intervals to assess risk premium valuations, ranging from the last five years (5) to the last 40 years (40). To calculate Sharpe ratios, we use average monthly T-bill yield during a year as the risk-free rate for that year. Notable points are:
- Relatively short lookback intervals are better than relatively long ones.
- For long lookback intervals the 60-40 benchmark is competitive with SACEVS based on CAGRs, but SACEVS wins all lookback intervals based on Sharpe ratio.
One interpretation is that risk perceptions/tolerances change over time, and investors tend to base them on five to 15 years of historical data. However, the available sample period is not long for this kind of test.
However, the lookback interval for SACEVS with ETFs as tracked is inception-to-date (ITD), ranging from about 15 years to about 30 years. Substituting a 10-year look-back interval for the ITD interval in that shorter-term test makes its allocations more like those summarized in the first chart above and lowers CAGR and Sharpe ratio for Best Value materially and for Weighted modestly. This inconsistency undermines confidence in strategy robustness. Differences in assets and premium calculation inputs may contribute to the inconsistency.
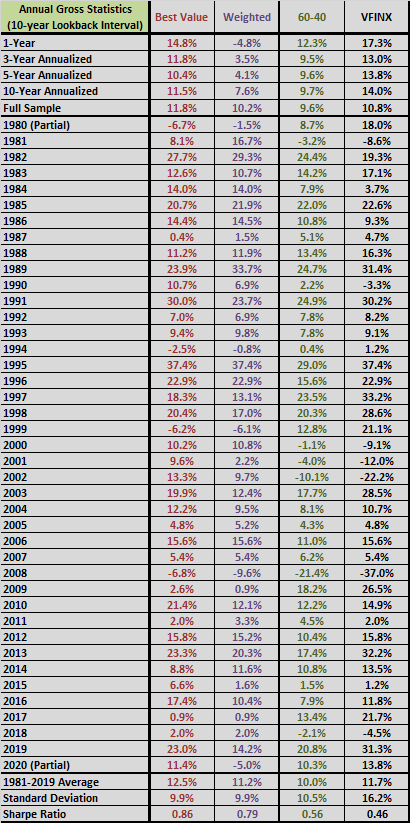
For reference, the following tables provide gross monthly (upper table) and annual (lower table) performance statistics for the 10-year lookback interval featured above.

In summary, evidence from the available test period suggests that SACEVS applied to mutual funds beats a relevant benchmark over the past 40 years, but magnitude of outperformance is somewhat sensitive to the lookback interval used for risk premium estimation and may be dissipating.
Cautions regarding findings include:
- As noted, candidate assets and variables used to measure risk premiums are somewhat different from those used for SACEVS as tracked (such as as-reported earnings rather than operating earnings). Some of the substitutions introduce approximations.
- As noted, calculations above ignore fund switching frictions. There may be none.
- Other variables may work better or worse for measuring term risk, credit risk and equity risk premium valuations. Simple experimentation would introduce data snooping bias.
- As noted, strategy outperformance is sensitive to the length of the lookback interval used to determine overvaluation/undervaluation of current risk premiums, and the available sample is not long for such sensitivity testing.
- Other mutual fund vehicles for capturing term risk, credit risk and equity risk premiums may work better or worse. However, simple experimentation would introduce snooping bias.