Are overnight trading motivations systematically different from those that drive trading during normal trading hours? In the January 2015 version of their paper entitled “Tug of War: Overnight Versus Intraday Expected Returns”, flagged by a subscriber, Dong Lou, Christopher Polk and Spyros Skouras (1) decompose abnormal returns associated with well-known stock return predictors into overnight and intraday components and (2) investigate whether differences between institutional and other traders account for differences. Using return, firm characteristic and institutional ownership data for a broad sample of U.S. stocks (excluding low-priced and the smallest fifth of stocks) during 1993 through 2013, they find that:
- On average, the gross positive return to intermediate-term momentum occurs overnight.
- Specifically, hedge strategy that each month buys (sells) the capitalization-weighted tenth of stocks with the highest (lowest) past 12-month returns, with a skip-month before portfolio formation, generates an average gross monthly excess return of 0.89% overnight and -0.18% intraday.
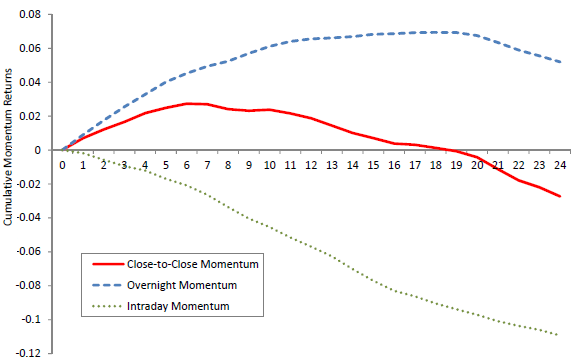
- The positive overnight component persists for up to a year, while the negative intraday component persist for at least two years (see the chart below).
- Results are robust across subsamples and stronger for large-capitalization and high-priced stocks.
- Results also hold for earnings momentum and industry-level momentum strategies.
- Similarly, the gross positive return to short-term reversal also occurs overnight. Specifically, a hedge strategy that each month sells (buys) the capitalization-weighted tenth of stocks with the highest (lowest) last-month returns generates an average gross monthly excess return of 1.01% overnight and -0.86% intraday.
- In contrast, returns to size, value and many other characteristics occur entirely intraday. Specifically:
- A hedge strategy that each month buys (sells) the capitalization-weighted tenth of stocks with the smallest (largest) market capitalizations generates an average gross monthly excess return of 0.13% overnight and 0.56% intraday.
- A hedge strategy that each month buys (sells) the capitalization-weighted tenth of stocks with the highest (lowest) book-to-market ratios generates an average gross monthly excess return of -0.11% overnight and 0.41% intraday.
- Results for profitability, investment, beta, idiosyncratic volatility, equity issuance, accruals and turnover are similar.
- Analysis of institutional trading indicates that the overnight-intraday dichotomy is reasonably attributable to differences in trading behaviors and strategies between institutions that trade intraday and lean toward value and individuals who may trade overnight and lean toward momentum.
The following chart, taken from the paper, tracks gross cumulative returns during a 24-month holding period to the momentum hedge strategy specified above overall (red line), overnight (dashed blue line) and intraday (dotted green line). Results indicate that:
- Positive overnight returns build for about a year.
- Negative intraday returns persist throughout the two-year holding period.
- Overall momentum returns thus peak at about six months and reverse at about 18 months.

In summary, evidence indicates that essentially all of the intermediate-term momentum and short-term reversal effects occur overnight, while those of other strategies primarily occur intraday.
Investors following a stock characteristic-based strategy may want to set systematic entry/exit times accordingly.
Cautions regarding findings include:
- Reported results are gross, not net. Accounting for the trading frictions and shorting costs associated with monthly portfolio reformation would reduce these returns. Shorting may not be feasible for some stocks.
- Moreover, daily entries and exits to exploit differences between overnight and intraday behaviors would generate very large cumulative trading frictions.
See also “Buy at the Close and Sell at the Open?” and “The Lure of Trading at the Open?”.