Does the currency carry trade, financing short-term deposits in currencies with high interest rates with short-term loans in currencies with low interest rates (or being long and short forward contracts in currencies with high and low interest rates) generate a reliably attractive return? In the November 2014 version of their paper entitled “Empirical Evidence on the Currency Carry Trade, 1900-2012”, Nikolay Doskov and Laurens Swinkels measure annual nominal and real carry trade returns for a large sample of currencies over a long period covering multiple currency regimes. They use yields on local Treasury bills (T-bills) or equivalents to approximate short-term interest rates and make some adjustments to account for government defaults. To estimate carry trade returns, they sort currencies each year based on associated T-bill yields and take equally weighted long (short) positions in the four currencies with the highest (lowest) yields. Using annual exchange rates and associated T-bill yields for 20 currencies during 1900 through 2012 (19 currencies before 1925 and 12 currencies after 1998), they find that:
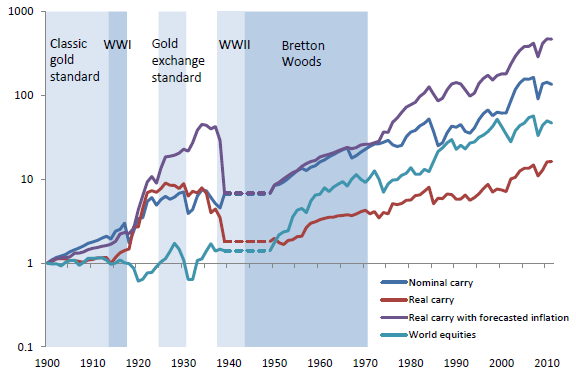
- Over the entire sample period, the currency carry trade generates a gross annualized excess return (relative to the T-bill yield) of 2.4% and a gross annual Sharpe ratio of 0.26. Excluding the turbulent 1940s increases gross annualized excess return to 3.2% and gross annual Sharpe ratio to 0.38, very competitive with buying and holding equities (see the chart below).
- However, the carry trade occasionally loses big, supporting belief that the long-term excess return is compensation for crash risk. For example, excess return is close to -10% during each of 1942, 1943 and 1945 and -32% during 1946.
- Carry trade losses sometimes (as in 1931 and 2008) coincide with large declines in global equities. However, there are many years during which the carry trade effectively diversifies long equity positions.
- Trading on real interest rate differences is about as profitable as trading on nominal interest rate differences only for traders who have some ability to predict inflation. Over the entire sample period, correlation of annual returns for the two approaches is only 0.39 (but increases to 0.64 after 1985).
- Results are generally robust to the exact method of estimating carry trade returns.
The following chart, taken from the paper, shows the cumulative gross excess returns in U.S. dollars of four strategies:
- Currency carry trade (equally weighted top four minus bottom four) based on annual ranking by last-year nominal interest rate (T-bill yield).
- Currency carry trade based on annual ranking by last-year real interest rate (last-year nominal rate minus last-year inflation rate).
- Currency carry trade based on annual ranking by real interest rate with forecasted inflation rate (last-year nominal interest rate minus the average of last-year and next-year inflation rates).
- Value-weighted equities for the same 20 countries.
Analysis excludes the turbulent years between 1940 and 1949. Carry trade strategies include leverage such that volatilities of annual returns equal that of world equity returns over the full sample period (leverage ratio of 2.1 for nominal carry, 2.0 for real carry and 1.8 for real carry with forecasted inflation). Before World War II, the currency carry trade strategies outperform equities. Since World War II, global equity performance is about the same as the nominal carry trade and the real carry trade with inflation forecasting. However, results do not account for any trading frictions or cost of leverage, and an investor could not know the required leverage in real time.

In summary, evidence suggests that the currency carry trade is profitable over the long run and competitive with equities, but not immune to crashes.
Cautions regarding findings include:
- As noted in the paper, analysis employs some arguable modeling and data assumptions/approximation that may affect findings.
- As noted in the paper, using annual data constrains the agility of a carry trade strategy. However, results for 1990 through 2012 are similar for annual and quarterly data.
- As noted, estimated returns are gross, not net. Accounting for the frictions involved in executing currency trading strategies and in maintaining equity tracking portfolios would reduce these returns. Incorporating the cost of leverage for currency carry trade strategies would lower the performance shown above.