“Optimal Monthly Cycle for SACEMS?” investigates whether using a monthly cycle other than end-of-month (EOM) to pick winning assets improves performance of the Simple Asset Class ETF Momentum Strategy (SACEMS). This strategy each month picks winners from the following set of exchange-traded funds (ETF) based on total returns over a specified lookback interval:
PowerShares DB Commodity Index Tracking (DBC)
iShares MSCI Emerging Markets Index (EEM)
iShares MSCI EAFE Index (EFA)
SPDR Gold Shares (GLD)
iShares Russell 2000 Index (IWM)
SPDR S&P 500 (SPY)
iShares Barclays 20+ Year Treasury Bond (TLT)
Vanguard REIT ETF (VNQ)
3-month Treasury bills (Cash)
In response, a subscriber asked whether sticking with an EOM cycle for determining the winner, but delaying signal execution, affects strategy performance. To investigate, we compare 23 variations of SACEMS portfolios that all use EOM to pick winners but shift execution from the contemporaneous EOM to the next open or to closes over the next 21 trading days (about one month). For example, EOM+5 uses an EOM cycle to determine winners but delays execution until the close five trading days after EOM. We focus on gross compound annual growth rate (CAGR) and maximum drawdown (MaxDD) as key performance statistics for the Top 1, equally weighted (EW) Top 2 and EW Top 3 portfolios of monthly winners. Using daily dividend-adjusted opens and closes for the asset class proxies and the yield for Cash during February 2006 (limited by DBC) through January 2019, we find that:
Specific trading assumptions are:
- For baseline SACEMS (EOM Close), reallocate at each monthly close based on total returns over the past four months (assume that 4-month past returns for the ETFs can be accurately estimated just before the close). For other variations, signal anticipation is unnecessary.
- Ignore trading (switching) frictions, which would be the same for all variations.
- Ignore any tax implications of trading.
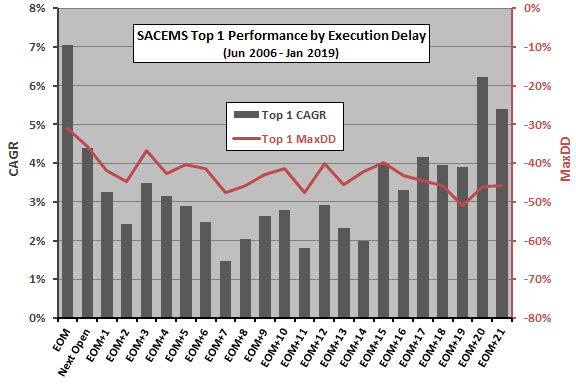
The following chart shows gross CAGRs and MaxDDs for SACEMS Top 1 across all 23 signal execution variations over the available sample period. Results are noisy, due at least in part to slight differences in start and stop dates. Findings generally warn against delays in signal execution. Specifically:
- All 22 delayed executions have lower CAGRs than the EOM baseline. Average CAGR for delayed execution is 3.2%, compared to 7.1% for no delay.
- All delayed executions have deeper MaxDDs than the EOM baseline. Average MaxDD for delayed execution is -43%, compared to -30% for no delay.
Results for CAGR suggest interaction with a turn-of-the-month effect. Results for MaxDD show a rough trend of longer delays producing deeper drawdowns.
Next, we look at the EW Top 2 portfolio.

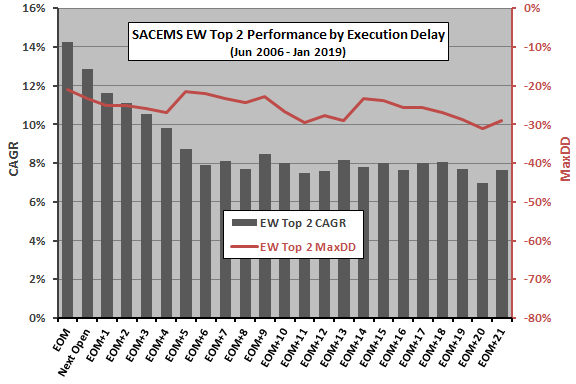
The next chart shows gross CAGRs and MaxDDs for SACEMS EW Top 2 across all 23 signal execution variations over the available sample period. Results are somewhat noisy, due at least in part to slight differences in start and stop dates. Findings consistently warn against delays in signal execution. Specifically:
- All delayed executions have lower CAGRs than the EOM baseline. Average CAGR for delayed execution is 8.6%, compared to 14.3% for no delay.
- All but one delayed executions have deeper MaxDDs than the EOM baseline. Average MaxDD for delayed execution is -26%, compared to -21% for no delay.
Finally, we look at the EW Top 3 portfolio.

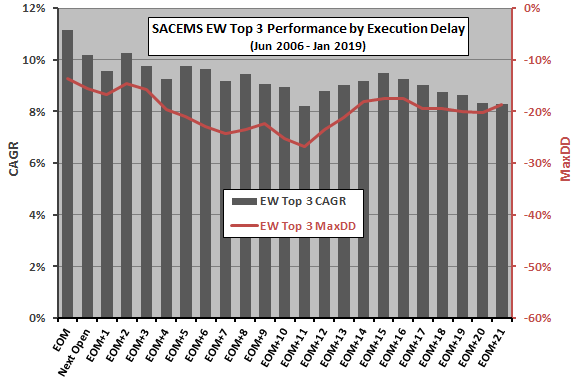
The final chart shows gross CAGRs and MaxDDs for SACEMS EW Top 3 across all 23 signal execution variations over the available sample period. Again, results are noisy, due at least in part to slight differences in start and stop dates. Findings again consistently warn against delays in signal execution. Specifically:
- All delayed executions have lower CAGRs than the EOM baseline. Average CAGR for delayed execution is 9.2%, compared to 11.1% for no delay.
- All delayed executions have deeper MaxDDs than the EOM baseline. Average MaxDD for delayed execution is -20%, compared to -14% for no delay.

In summary, evidence from available data indicates that delaying execution of SACEMS monthly portfolio changes is likely to lower strategy performance, including degraded crash protection.
Cautions regarding findings include:
- The sample period is short for assessing sources of differences in outcomes, especially in terms of number of bull and bear market regimes.
- Brute force experimentation introduces data snooping bias, such that performance of the best (worst) execution delay overstates (understates) expected performance. Daily data is noisier than longer frequencies.
- As noted, sample periods for different execution delays are slightly different.
Contrast findings with those in “Effects of Execution Delay on SACEVS”.