How big is the return premium associated with stock illiquidity? In his March 2014 paper entitled “The Pricing of the Illiquidity Factor’s Systematic Risk”, Yakov Amihud specifies and measures an illiquidity premium. He defines illiquidity as the average daily ratio of absolute return to dollar volume over the past three months. He specifies the illiquidity premium as the average four-factor (market, size, book-to-market, momentum) alpha on a set of hedge portfolios that are long (short) the stocks that are most (least) illiquid. Specifically, each month he:
- Sorts stocks on illiquidity and deletes the 1% with highest illiquidities as unreliable.
- Ranks surviving stocks on standard deviation of daily returns (volatility) over the last three months into three segments (terciles).
- To avoid confounding volatility and illiquidity, ranks stocks within each volatility tercile into illiquidity quintiles (creating 15 volatility-illiquidity portfolios). This step effectively controls for size, which relates negatively to volatility.
- Skips two months (avoiding reversal/momentum effects) and calculates value-weighted returns for the 15 portfolios during the third month after formation based on market capitalizations at the end of the prior month.
- Calculates the monthly illiquidity return as the average difference in returns between highest and lowest illiquidity portfolios across the three volatility groups.
- Calculates illiquidity alpha by controlling monthly illiquidity returns for market, size, book-to-market and momentum factors over the past 36 months.
Using daily and monthly data for all NYSE and AMEX common stocks and monthly factor returns during 1950 through 2012, he finds that:
- Over the entire sample period:
- Average monthly gross illiquidity return is 0.38% (about 4.7% annually). This return is positive in 56.6% of all months.
- Average monthly gross illiquidity four-factor alpha is 0.33% (about 4.0% annually).
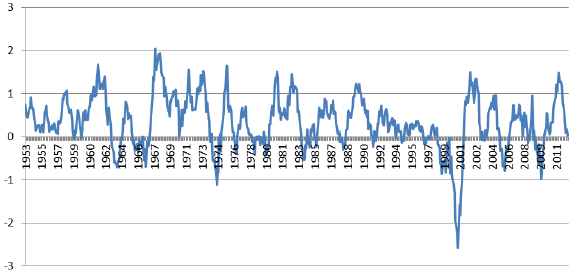
- Average gross illiquidity return and alpha are lower in the second of two equal subperiods due to unusually negative monthly returns during 2000 (see the chart below).
- Regarding relationships with other factors:
- There is strong negative relationship between illiquidity and size (small stocks tend to be illiquid).
- There is a negative relationship between illiquidity and the market (falling markets tend to elevate illiquidity effects).
- There is a positive relationship between illiquidity and book-to-market ratio (value firms tend to be illiquid).
- An increase in funding illiquidity (measured as the mean-adjusted difference in yields between BAA and AAA corporate bonds), boosts the stock illiquidity premium.
The following chart, taken from the paper, shows the 12-month moving average of gross illiquidity alpha over the entire sample period. While mostly positive, alpha is negative during 11 of 12 months during 2000 when relatively illiquid technology stocks crash. The two most negative values are -9.7% during February 2000 and -5.8% during September 2000. Illiquid stocks also have unusually low returns during 1973-1974 (oil crisis) and 2008-2009 (financial crisis).

In summary, evidence indicates that stocks with relatively high (low) lagged past illiquidity, measured by impact of trading on price, generate relatively high (low) gross future returns.
Cautions regarding findings include:
- Reported results are gross, not net. Accounting for trading frictions and shorting costs from monthly portfolio reformation would reduce returns.
- Moreover, implementation costs may vary with liquidity such that net findings differ from gross findings. By definition, impact of trading on price is elevated for illiquid stocks, and these stocks may also have relatively high bid-ask spreads. Monthly turnover may also vary across illiquidity quintiles.
- The illiquidity return and alpha measurement process is complex and potentially subject to snooping bias in selection of variables, rules and measurement parameters.
- Illiquidity data collection/processing may be beyond the reach of many investors, or costly if delegated.