Subscribers have asked whether substituting leveraged exchange-traded funds (ETF) in the “Simple Asset Class ETF Momentum Strategy” (SACEMS) might enhance performance. To investigate, we execute the strategy with the following eight 2X leveraged ETFs, plus cash:
DB Commodity Double Long (DYY)
ProShares Ultra MSCI Emerging Markets (EET)
ProShares Ultra MSCI EAFE (EFO)
ProShares Ultra Gold (UGL)
ProShares Ultra S&P500 (SSO)
ProShares Ultra Russell 2000 (UWM)
ProShares Ultra Real Estate (URE)
ProShares Ultra 20+ Year Treasury (UBT)
3-month Treasury bills (Cash)
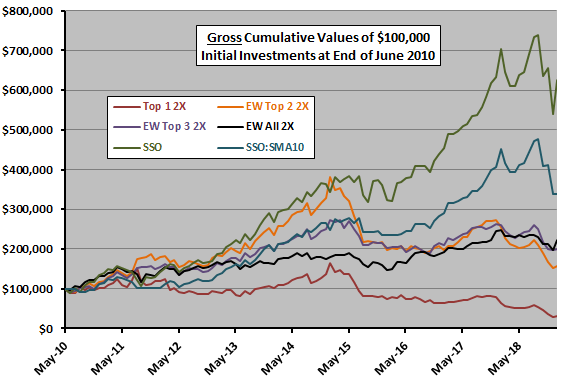
We consider portfolios of Top 1, equally weighted (EW) Top 2 and EW Top 3 past winners. We include as benchmarks: an equally weighted portfolio of all ETFs, rebalanced monthly (EW All); buying and holding SSO (SSO); and, holding SSO when the S&P 500 Index is above its 10-month simple moving average (SMA10) and Cash when the index is below its SMA10 (SSO:SMA10). Using monthly adjusted closing prices for the specified ETFs and the yield for Cash over the period January 2010 (the earliest month prices for all eight ETFs are available) through January 2019, we find that:
Trading assumptions are:
- At the end of each month, reform SACEMS portfolios using 2X ETFs with the highest total returns over the past four months (assume past returns can be calculated just before the close).
- Ignore portfolio trading (switching) frictions.
- Ignore any tax implications of trading.
The following chart compares cumulative performances of the three SACEMS 2X portfolios and the three benchmarks over the available sample period. Notable points are:
- During this sample period, the U.S. stock market is mostly in a bull state, and buying and holding SSO easily wins, followed by SSO:SMA10.
- EW Top 3 outperforms EW Top 2, which in turn outperforms Top 1. Top 1 loses capital.
- Based on terminal value, EW All is competitive with EW Top 3.
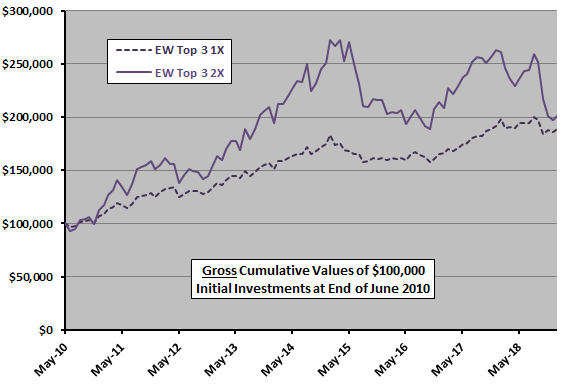
How does SACEMS EW Top 3 2X compare to SACEMS EW Top 3 1X?

The next chart compares cumulative performances of SACEMS EW Top 3 2X and SACEMS EW Top 3 1X over the available sample period of the former. The leveraged approach generally leads, but with high volatility. Quantitatively:
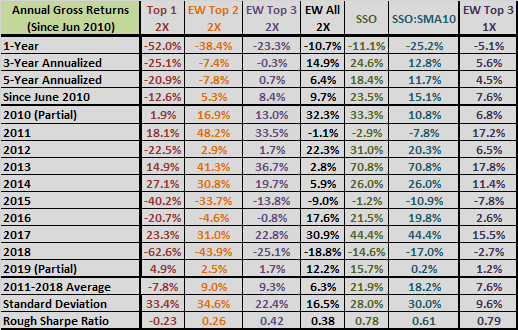
- Compound annual growth rates (CAGR) are 8.4% for 2X versus 7.6% for 1X, with maximum drawdowns (MaxDD) -31% versus -23%.
- Rough annual Sharpe ratios (zero risk-free rate) for full years 2011-2018 are 0.42 for 2X and 0.73 for 1X.
However, the available sample period is extremely short for such comparisons in terms of variety of market conditions.
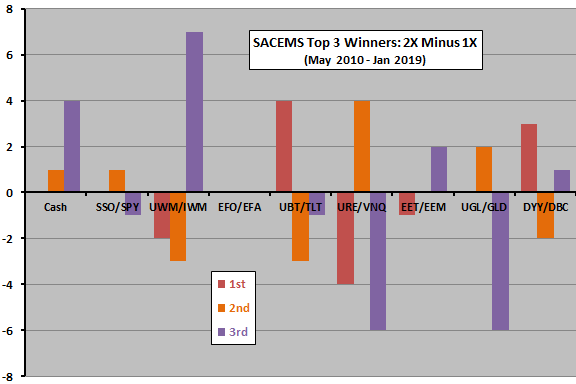
Why do risk-adjusted performances of SACEMS 2X and SACEMS 1X differ materially?

The final chart compares summarizes differences in asset class ETF winners (1st, 2nd and 3rd places) for 2X and 1X ETF universes over the sample period available for the former (105 for each place). While differences are difficult to characterize, there are many.
Also, managers of leveraged ETFs generally target daily performance, with daily rebalancing tending to degrade returns for all such funds. This process impacts 2X and 1X relative performances over monthly holding intervals.

For reference, the following tables summarize detailed SACEMS 2X performance statistics over the available sample period, with EW Top 3 1X included in the rightmost column for comparison.


In summary, evidence from a short available sample period offers mixed support for belief that substituting a set of 2X ETFs for the baseline 1X ETFs enhances SACEMS performance.
Cautions regarding findings include:
- As noted, the available sample period is very short and includes no deep equity bear markets.
- As noted, managers of leveraged ETFs target daily performance, with daily rebalancing perturbing returns for extended holding intervals. In that regard, they are not well-suited to an intermediate-term momentum strategy.
- Less liquid leveraged ETFs may bear higher trading frictions than unleveraged counterparts.
For related tests, see “Leveraged Sector Fund Momentum Strategy” and “Leveraged Style ETF (2X and -2X) Momentum Strategy”.