A subscriber inquired about a “hot hand” strategy that each year picks the top performer from a family of diversified equity mutual funds (not including sector funds) and holds that winner the next year. To evaluate this strategy, we consider Vanguard diversified equity mutual funds with inceptions no later than September 2011. The test period is the lifetime of SPDR S&P 500 (SPY), which serves as a benchmark. We assume no costs or holding period constraints/delays for switching from one fund to another. We also simplify calculations by assuming that end-of-year “hot hand” fund identification and fund switches occur simultaneously (in other words, we can accurately rank mutual funds one day before the end of the year). Using monthly total returns for SPY and for Vanguard diversified equity mutual funds as available during December 1992 through December 2018, we find that:
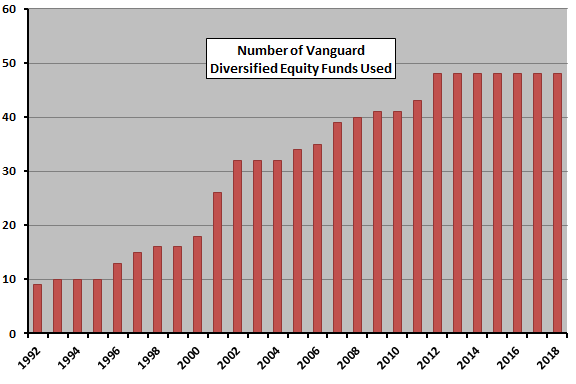
The following chart summarizes the number of Vanguard diversified equity mutual funds available for at least 12 months over the sample period, ranging from an initial 9 to a final 48. Some are passive (index) funds, and others are active. They include “Admiral Shares” funds, which “are a separate share class of Vanguard mutual funds that were created to pass along the savings that result from larger accounts to the investors who own them.” The “hot hand” fund for each year comes from this growing universe.
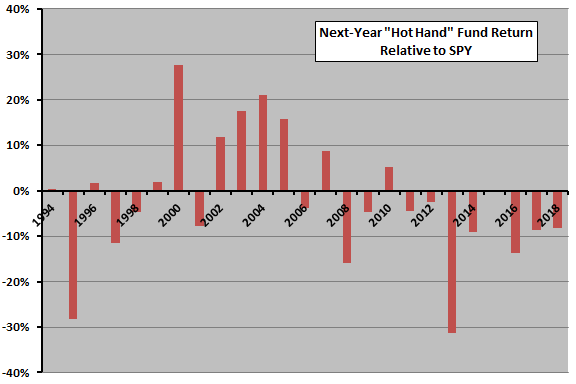
How does the next-year performance of the “hot hand” fund compare to that of SPY?

The next chart summarizes the next-year performance of the “hot hand” fund relative to SPY over the available sample period. The “hot hand” fund (SPY) has average annual return of 8.8% (10.6%), with standard deviation of annual returns 19.5% (18.1%) and maximum drawdown based on annual data -53% (-37%) in 2008. Rough annual Sharpe ratio (average annual return divided by standard deviation) for the “hot hand” fund (SPY) is 0.45 (0.58). The “hot hand” fund beats SPY only 10 of 25 years.
For another perspective, we look at cumulative performance.

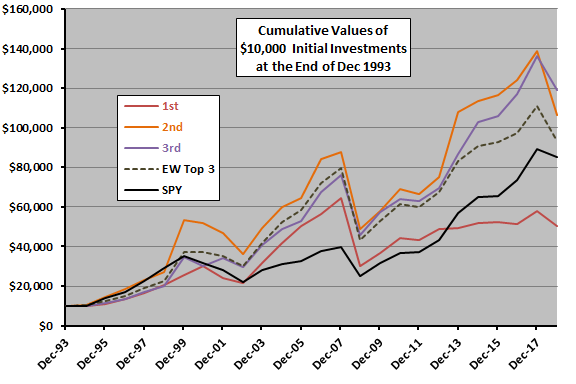
The next chart compares cumulative values of $10,000 initial investments at the end of December 1993 in five portfolios over the available sample period:
- 1st – “hot hand” (prior-year winner) mutual fund.
- 2nd – prior-year second place mutual fund.
- 3rd – prior-year third place mutual fund.
- EW Top 3 – Equal-weighted combination of 1st, 2nd and 3rd.
- SPY.
Results suggest that:
- Top performing mutual funds from the specified universe do not avoid crashes.
- Diversification across several mutual funds with relatively strong past-year performance may be attractive (but still does not avoid crashes).
Average annual returns for 2nd and 3rd are 13.0% and 12.4%, respectively, with standard deviations 26.9% and 21.0% and rough Sharpe ratios 0.48 and 0.59. Rough Sharpe ratio for EW Top 3 is 0.55.
Capital gains tax considerations may drive use of annual performance ranking to determine “hot hands.” Might shorter ranking/holding intervals work better for tax-indifferent investors?

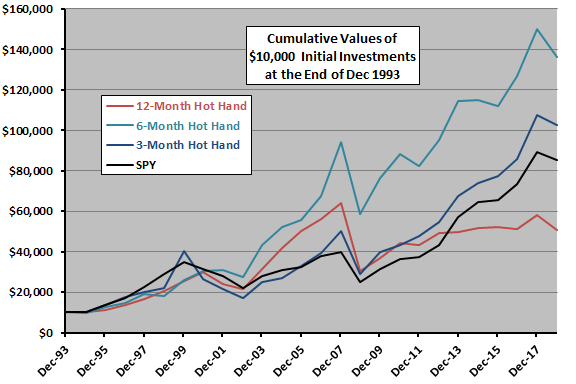
The final chart compares cumulative values of $10,000 initial investments at the end of December 1993 in “hot hand” strategy variations based on 12-month, 6-month and 3-month ranking/holding intervals. The 6-month (3-month) variation every six (three) months picks the fund with the highest return over the past six (three) months and holds it for six (three) months. As above, we assume no switching constraints and no lag between identifying the “hot hand” fund and switching to it .
The 6-month ranking interval performs best, with average annual return 12.9%, standard deviation of annual returns 20.2% and rough annual Sharpe ratio 0.64. Rough annual Sharpe ratio for the 3-month ranking interval is 0.50 due to its high volatility.

In summary, evidence from simple tests on available data regarding performance of a relative momentum strategy applied to a broad family of diversified equity mutual funds is mixed. An annual “hot hand” is not so hot.
Cautions regarding findings include:
- Given the variability of returns, the sample is not long for this kind of analysis.
- As noted, we assume that 12-month, 6-month and 3-month mutual fund winners are accurately identifiable one day before the end of the interval.
- SPY is arguably not the most appropriate benchmark for the “hot hand” strategy, which includes funds of small stocks and international stocks.
- Testing multiple measurement intervals on the same set of funds introduces data snooping bias, such that performance for the optimal interval incorporates some luck.
This article is a third update. See also prior related analyses “Mutual Fund Hot Hand Performance Robustness Test” and “Mutual Fund Hot Hand Diversification”.