How lucky would a asset class picker with no skill have to be to match the performance of the Simple Asset Class Momentum Strategy (SACEMS), which each month picks winners from a set of eight exchange-traded funds (ETF) plus cash based on total returns over a specified lookback interval. To investigate, we run 1,000 trials of a “strategy” that each month allocates funds to one, the equally weighted two or the equally weighted three of these nine assets picked at random. We focus on gross compound annual growth rate (CAGR) and gross maximum drawdown (MaxDD) as key performance statistics. Using monthly total (dividend-adjusted) returns and for the specified assets during February 2006 (limited by DBC) through June 2019, we find that:
The set of SACEMS ETFs is:
- PowerShares DB Commodity Index Tracking (DBC)
- iShares MSCI Emerging Markets Index (EEM) until December 2007, and iShares JPMorgan Emerging Markets Bond Fund (EMB) thereafter
- iShares MSCI EAFE Index (EFA)
- SPDR Gold Shares (GLD)
- iShares Russell 2000 Index (IWM)
- SPDR S&P 500 (SPY)
- iShares Barclays 20+ Year Treasury Bond (TLT)
- Vanguard REIT ETF (VNQ)
- 3-month Treasury bills (Cash)
The random selection process is:
- Pick the first ETF randomly.
- Pick the second ETF randomly. If the second pick is the same as the first, repick randomly.
- Pick the third ETF randomly. If the third pick is the same as the first or second, repick randomly.
This process could still have a few duplicates within multi-ETF portfolios among 1,000 trials. We ignore ETF switching frictions for these portfolios, which would be higher than those for SACEMS portfolios due to higher turnovers.
Per prior research, the SACEMS lookback interval is four months. We compare the randomly picked portfolios of one, two or three ETFs to SACEMS Top 1, equally weighted (EW) Top 2 and EW Top 3 portfolios, respectively.
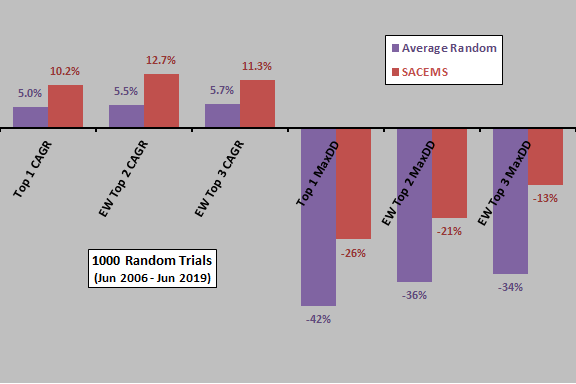
The following chart compares average CAGRs and average MaxDDs from the 1,000 random selection trials to CAGRs and MaxDDs for corresponding SACEMS portfolios over the available sample period. SACEMS wins easily in each case, suggesting that the strategy applies valuable information.
For greater insight, we look at some scatter plots.

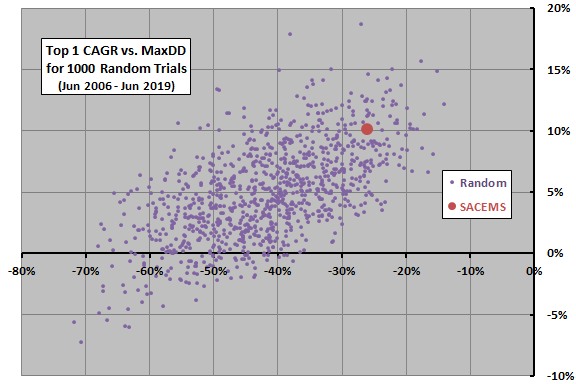
The following scatter plot relates CAGR to MaxDD for each of the 1-ETF random portfolios and for SACEMS Top 1 over the available sample period. SACEMS is comfortably in the upper-right part of the random scatter, winning 90.3% of the time based on CAGR and 92.1% of the time based on MaxDD. These win rates suggest value for SACEMS Top 1.
Next, we look at 2-ETF portfolios.

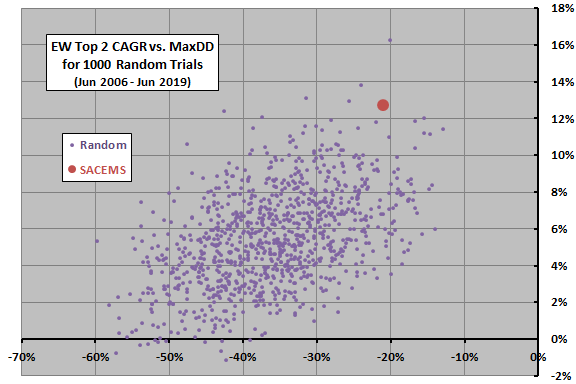
The next scatter plot relates CAGR to MaxDD for each of the 2-ETF random portfolios and for SACEMS EW Top 2 over the available sample period. We keep the horizontal and vertical scales the same as above for visual comparison. SACEMS is even more comfortably in the upper-right part of the random scatter, winning 99.6% of the time based on CAGR and 94.9% of the time based on MaxDD. These results suggest that SACEMS EW Top 2 very likely adds value.
Finally, we look at 3-ETF portfolios.

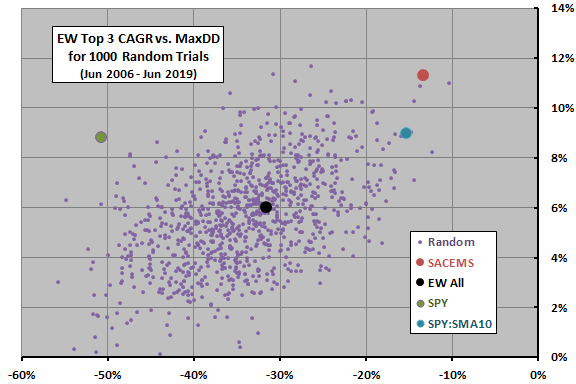
The final scatter plot relates CAGR to MaxDD for each of the 3-ETF random portfolios and for SACEMS EW Top 3 over the available sample period. We again keep the horizontal and vertical scales the same as above for visual comparison. SACEMS wins 99.8% of the time based on CAGR and 99.8% of the time based on MaxDD.
This plot also shows, for comparison, the CAGR-MaxDD relationships for:
- EW All – an equally weighted, monthly rebalanced portfolio of all nine assets.
- SPY – buy and hold SPY.
- SPY:SMA10 – hold SPY when prior-month S&P 500 Index is above its 10-month simple moving average (SMA10) and Cash when the index is below its SMA10.
Results show that SACEMS EW Top 3 very likely adds value, but the simple SPY:SMA10 is somewhat competitive. Because its only alternatives are SPY and cash, SPY:SMA10 may offer less robust inflation and crash protection over long sample periods.

In summary, evidence from contests with random asset class proxy picks indicates that SACEMS portfolios extract useful information from past returns.
Cautions regarding findings include:
- Results are gross, not net. Accounting for ETF switching frictions would reduce all CAGRs, more dramatically for the randomly generated portfolios because of their high turnovers.
- Sample duration is modest in terms of independent 4-month lookback intervals (about 39) and, especially, in terms of variety of economic and financial market conditions.
- Part of the strong outperformance of SACEMS diversified portfolios comes from luck (optimization of the lookback interval introduces data snooping bias).